
Beyond the Surface: Factor Drift in Lookalike Funds
Funds with similar holdings can behave differently over time due to shifting factor exposures, revealing hidden risks and return paths.


In the world of mutual funds, two portfolios with seemingly similar holdings can perform in vastly different ways over time. For many investors, this divergence feels counterintuitive—how can two funds holding the same set of stocks generate such dissimilar outcomes? The answer lies not just in what a fund holds, but how it holds it, and more importantly, how its factor exposures drift over time.
Comparing PPFAS FlexiCap with HDFC FlexiCap
This article compares two well-regarded Indian mutual funds—PPFAS FlexiCap and HDFC FlexiCap—both of which, at various points, share a surprising degree of portfolio overlap. Yet, their performance has diverged meaningfully. This case study illustrates why surface-level similarity can be deceptive without understanding the underlying factor dynamics.
High Overlap, Low Alignment
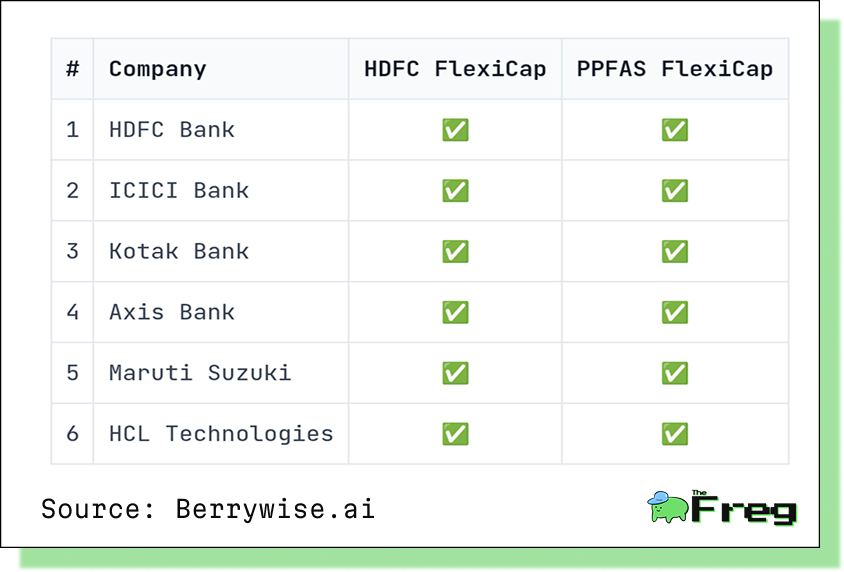
Both PPFAS FlexiCap and HDFC FlexiCap are classified under the same category—FlexiCap—and have overlapping core holdings in blue-chip companies.
Common holdings amongst Top-10 holdings of Each Fund
Understanding Factor Drift
Factor drift refers to the evolution of a fund’s exposure to various risk factors—such as growth, quality, and momentum—over time. These drifts arise due to active management decisions, macroeconomic shifts, etc.
Analysing the factor exposures for PPFAS FlexiCap and HDFC FlexiCap reveals that from 2015 to 2025, these two funds exhibited overlap in dominant factor exposure only 45% of the time. And even that overlap is attributable solely to one commonality: both funds had ‘Core’ factor as their top exposure during the same periods.
Beyond that shared core tilt, the paths diverge sharply.
Comparison of factor profiles over time
PPFAS FlexiCap
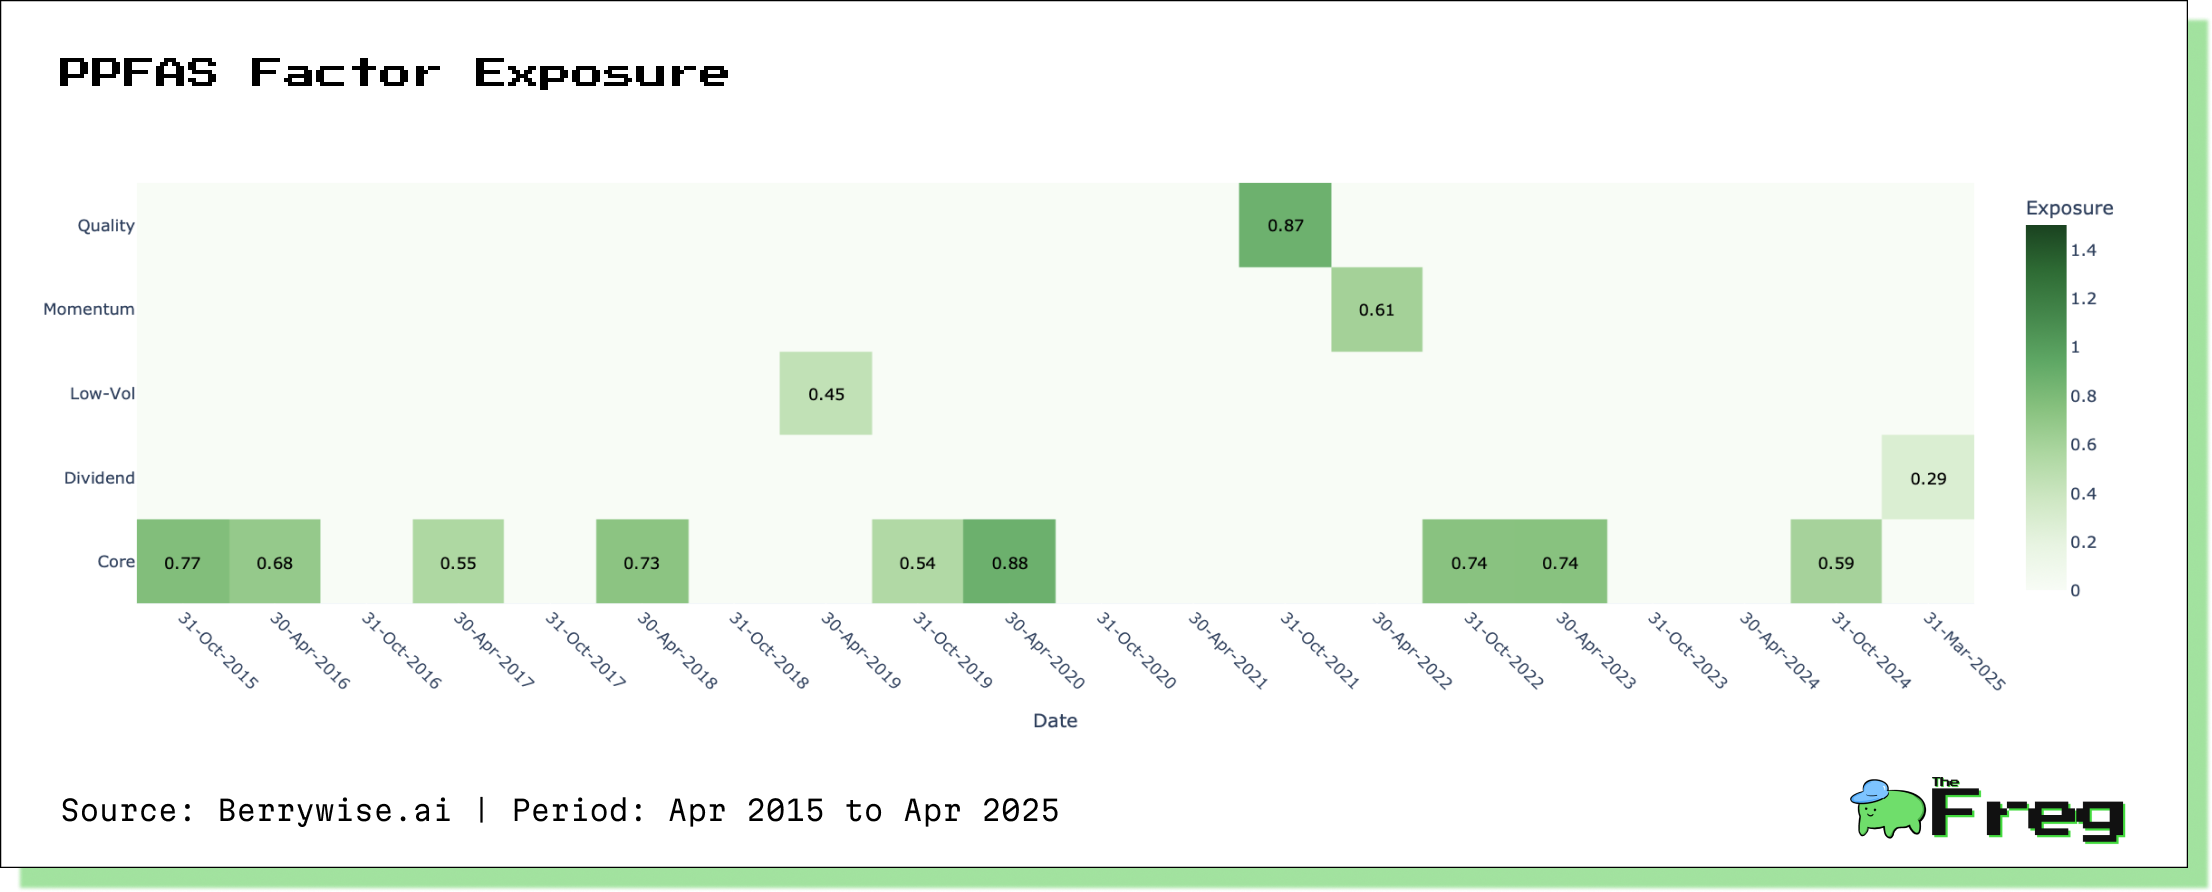
While PPFAS remained anchored to the core factor most of the time, it showed occasional, deliberate shifts:
- Dividend: Oct 2024 – Mar 2025
- Low Volatility: Oct 2018 – Apr 2019
- Momentum: Oct 2021 – Apr 2022
- Quality: Apr 2021 – Oct 2021
HDFC FlexiCap
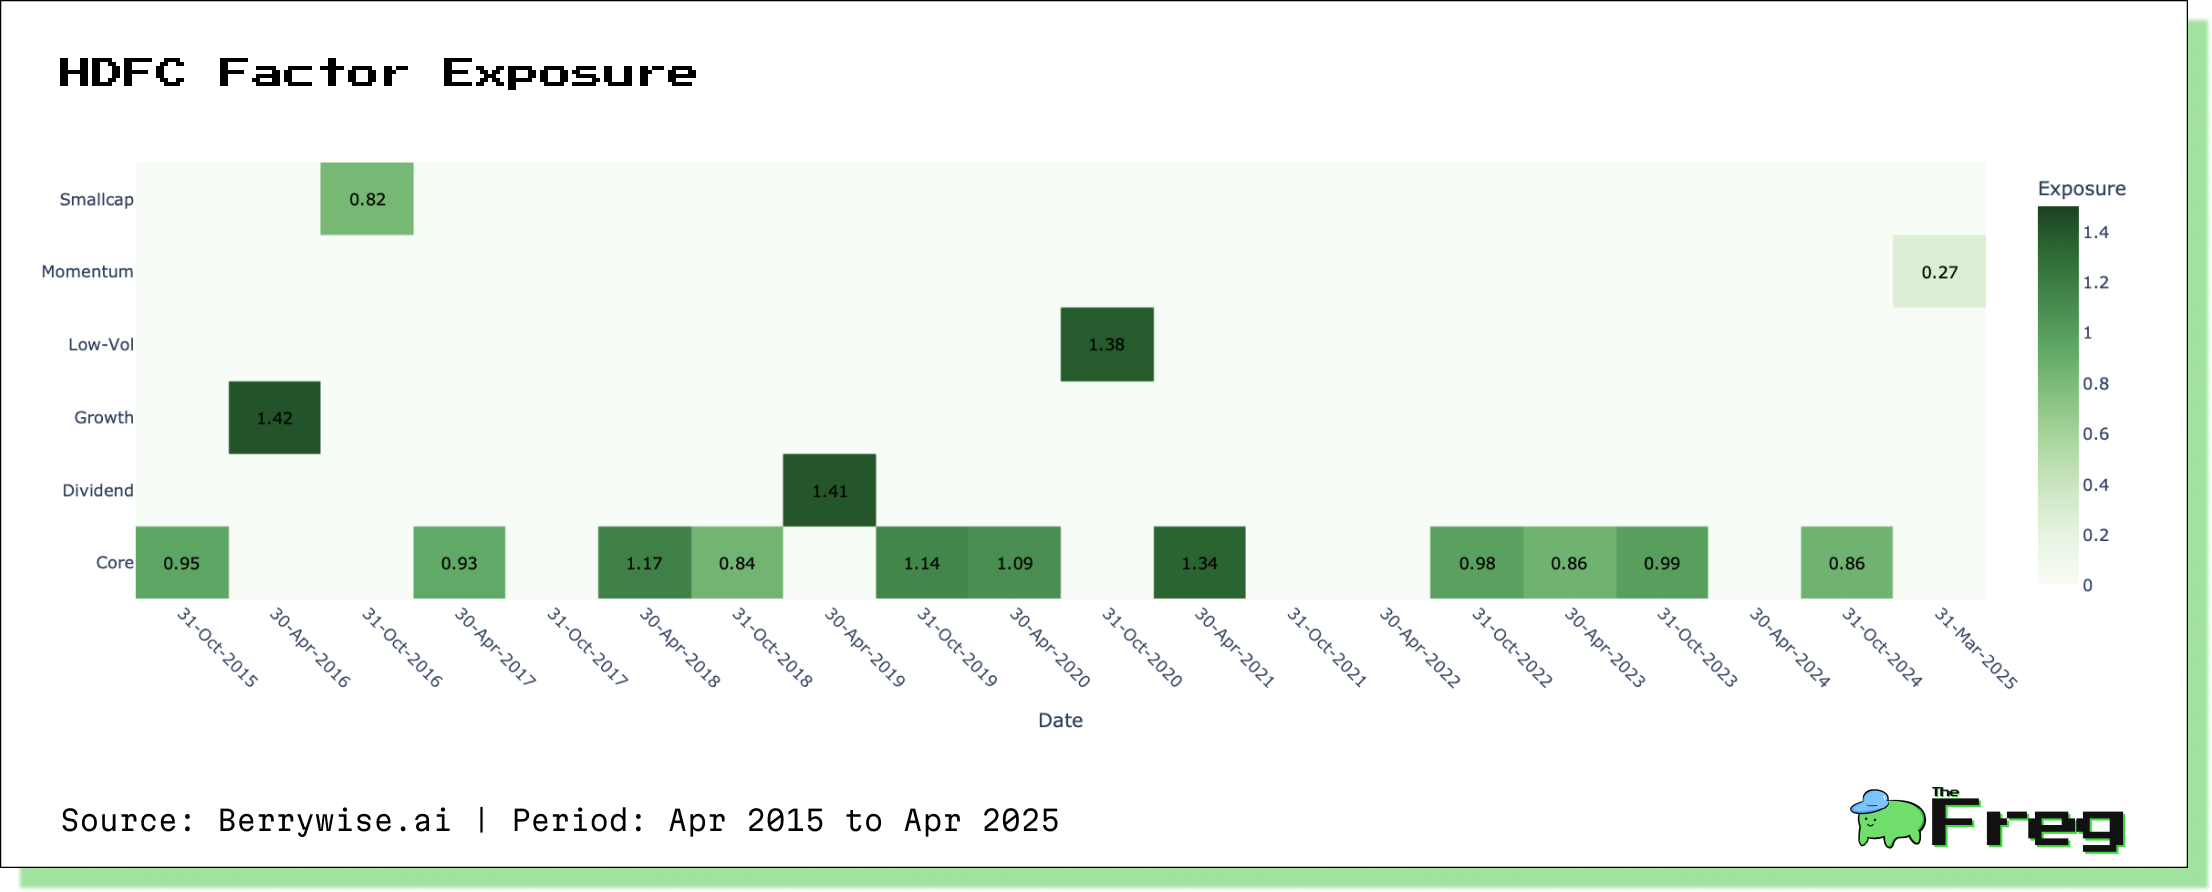
HDFC, too, maintained a dominant core exposure, but rotated more aggressively into other styles:
- Growth: Oct 2015 – Mar 2016
- Small-Cap: Apr 2016 – Oct 2016
- Dividend: Oct 2018 – Apr 2019
- Low Volatility: Apr 2020 – Oct 2020
- Momentum: Oct 2024 – Mar 2025
This difference in factor tilts led to diverging behavior across market cycles, especially during periods of heightened dispersion in factor performance.
Performance Divergence: A Compound Story
Over this 10-year horizon, despite shared holdings and parallel ‘Core’ leanings, PPFAS FlexiCap has outperformed HDFC FlexiCap by a cumulative margin of 103.03%. This divergence is not merely a function of stock selection, but of factor sensitivity and timing of exposures.
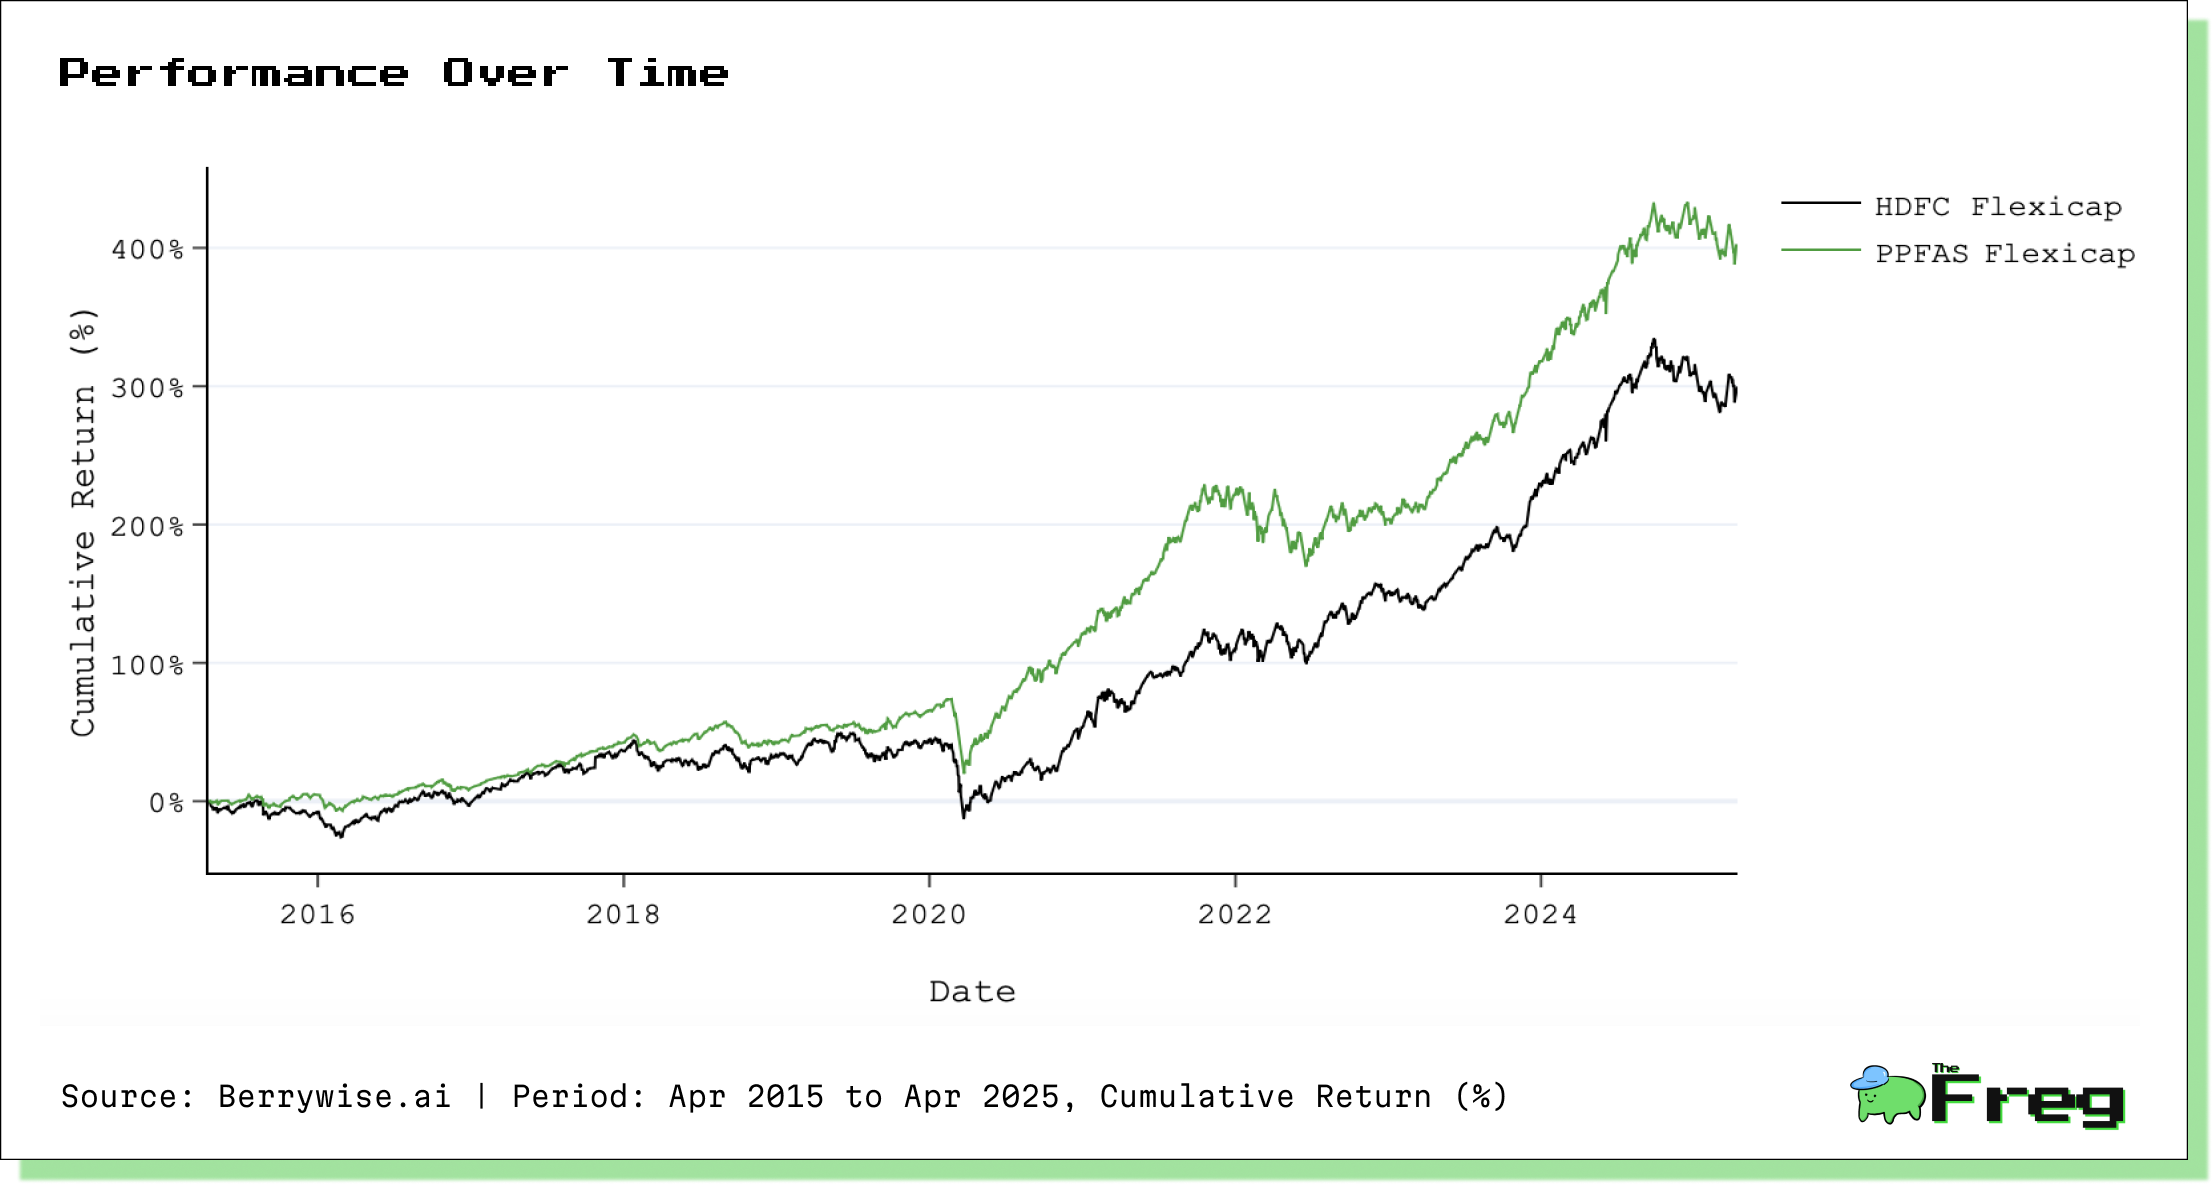
For instance:
- During the 2021–2022 momentum surge, PPFAS had active exposure, while HDFC did not.
- HDFC’s brief dip into small-cap and growth in 2015–2016 aligned with periods of heightened volatility and sharp reversals, which hurt performance.
- PPFAS’s global diversification and preference for quality and low-vol periods helped preserve capital during drawdowns.
PPFAS FlexiCap and HDFC FlexiCap may appear like fund twins from a distance. But under the hood, they reflect different philosophies, different cycles of factor exposure, and ultimately, different results. For the discerning investor, the lesson is clear: look beyond the surface—understanding factor drift is essential to navigating the complexity of modern portfolios.
Disclaimer: This article is based on data analysis and does not constitute investment advice. Investors should conduct their own research and consult with financial advisors before making investment decisions. Past performance is not indicative of future results.


