

Buying the Dip: What History Says About Indian Markets
Historical Nifty drawdowns over 10% often lead to strong rebounds, offering potential buying opportunities for long-term investors.


When markets fall sharply, investors often ask the same question: “Is this a good time to buy?”
History doesn’t repeat itself, but it does rhyme — and in the case of Indian equity markets, historical drawdowns offer useful clues for the long-term investor.
Sharper Drawdowns, Sharper Rebounds
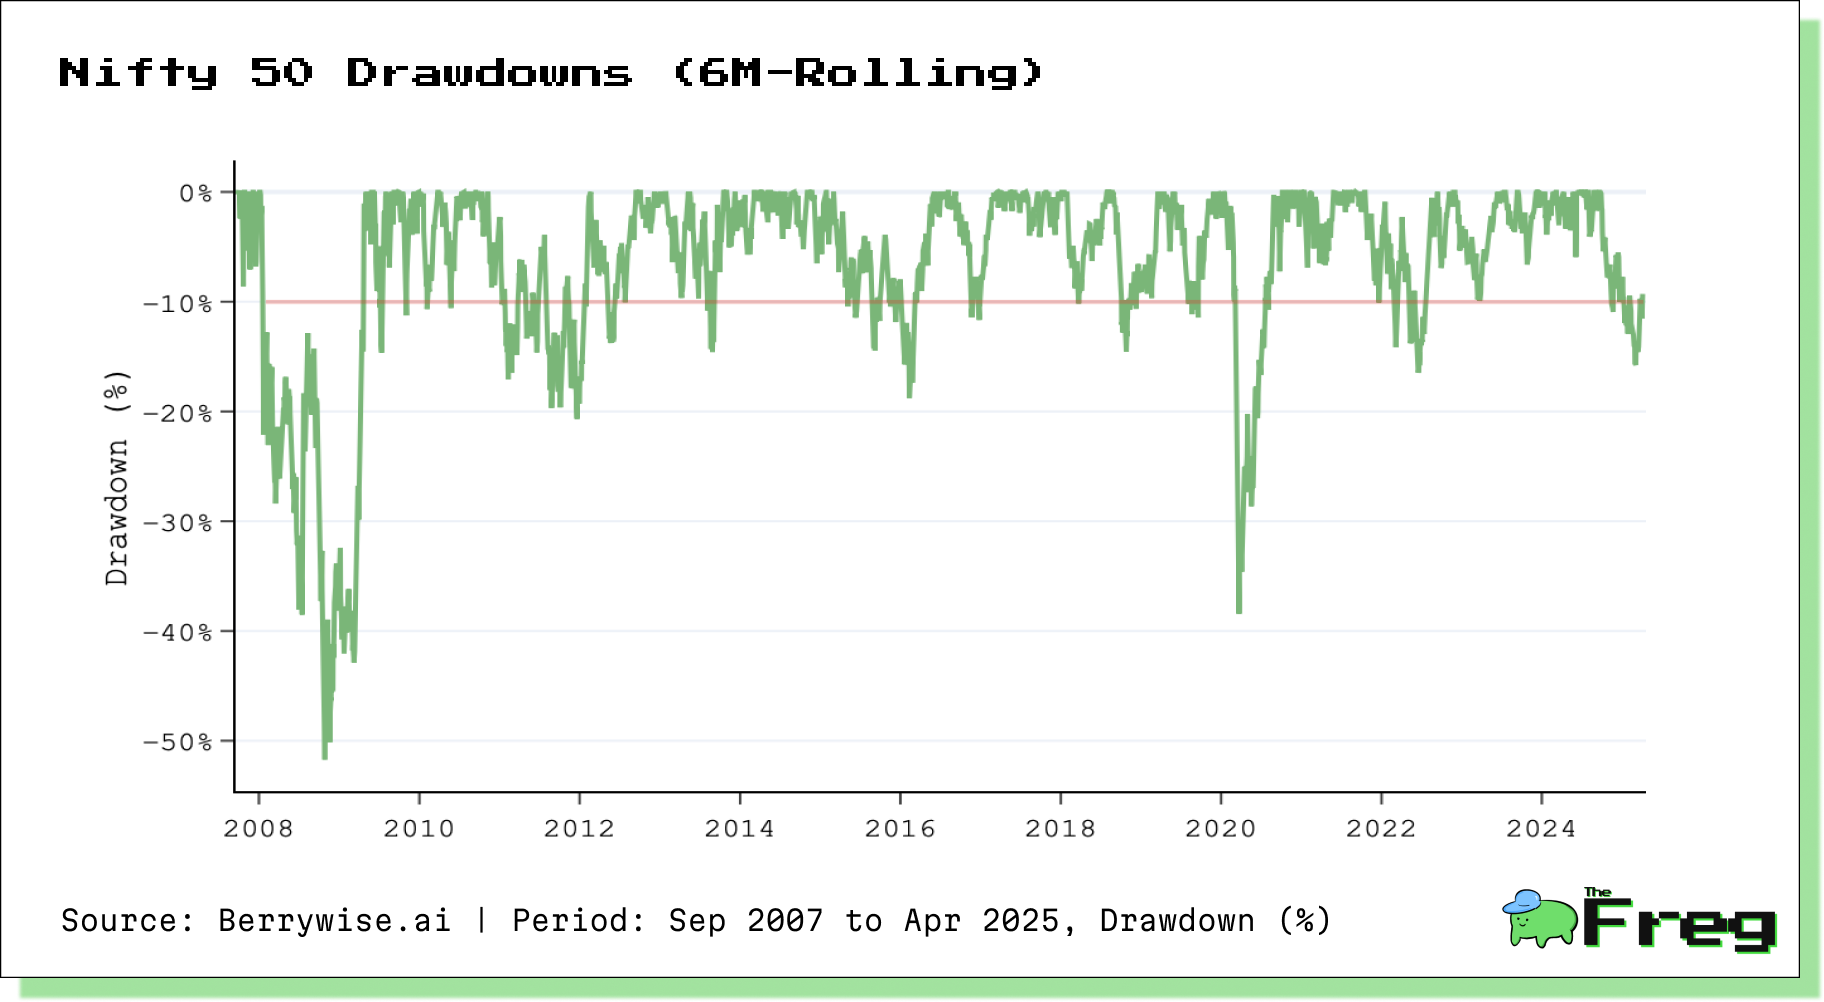
Analysis of past market corrections shows a compelling trend: the deeper the fall, the stronger the bounce.
Take the COVID-19 crash — the Nifty 50 plunged nearly 39.6%, only to rebound over 50% within the year. Similarly, the July 2022 correction saw the index drop 18%, followed by a 25% recovery in the same year.
This relationship between drawdown severity and rebound strength isn't unique to Nifty 50. The Nifty Midcap 100 and Nifty Smallcap 100 indices exhibit similar patterns — albeit with higher volatility or longer recovery timelines. Mid- and small-cap drawdowns tend to overshoot on both ends: they fall harder but often rally even more dramatically when sentiment turns.
What the Data Says
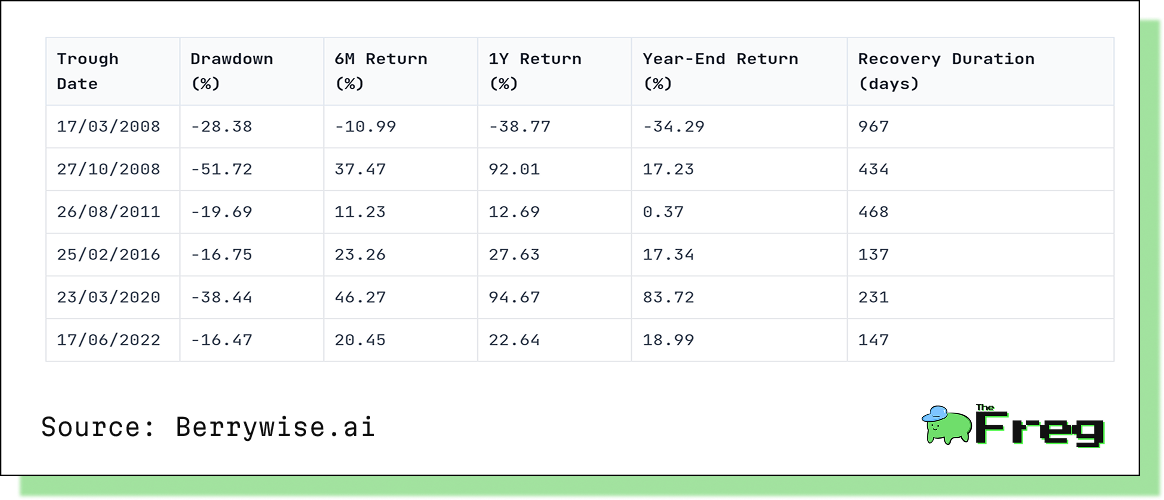
Using historical price data from 2005 to 2024, we identified periods where indices declined more than 10% over a six-month rolling window. Here's what we found:
- Average 6-month return post-trough: +21.3% (Nifty 50)
- Average 1-year return post-trough: +35.1%
These numbers suggest that buying after a 10–20% correction has historically led to solid gains within 6 to 12 months, especially when supported by improving fundamentals.
Today’s Market: A Familiar Set-Up?
Fast-forward to today, and several factors mirror those earlier bottoms:
- Nifty's trailing PE ratio has slipped below 20.
- FII outflows between September 2024 and February 2025 touched $25 billion, echoing past panic-selling phases.
- GDP growth forecasts for 2025/26 hover around 6.3–6.8%, down from earlier optimism — another echo of past slowdowns.
- Technical breakdowns and subdued sectoral breadth suggest bearish sentiment dominates.
In other words, the environment looks uncertain, but also statistically familiar.
The Hidden Hero: Domestic Liquidity
One key difference in recent years? Domestic liquidity.
Thanks to proactive RBI measures (e.g., bond purchases, rupee-dollar swaps) and rising household participation in equities, domestic investors have increasingly stepped in when FIIs pull out. From 2020 onward, Indian retail investors have helped prevent deeper corrections, contributing to India’s rise from a $4 trillion to $5 trillion market cap in under six months.
This growing local participation could reduce drawdown depths and shorten recovery times going forward.
The Risk of False Bottoms
Despite the statistical setup, investors should be cautious of false bottom signals:
- Volume inconsistencies: While recent drawdowns have been sharp, volumes haven’t shown the kind of sustained spike typically associated with lasting reversals.
- Technical breakdowns: The Nifty 50 recently broke below its super trend line support, triggering algorithmic selling — a potential sign of more pain ahead.
- Negative reactions to good news: Positive economic data hasn’t lifted sentiment. GIFT Nifty futures, for instance, suggested an 830-point gap-down even after upbeat indicators.
- Global correlation: With the Dow and Nasdaq also under pressure, a premature bottom in Indian markets cannot be ruled out.
Global Triggers Behind the Current Correction
This isn’t just a domestic story — the recent market weakness is a result of global and local factors colliding:
- Trade tensions: Reciprocal tariffs by the U.S. on several countries, including India, have spooked markets.
- FII selling: ₹10,355 crore was pulled out by foreign investors in early April alone.
- Domestic slowdown: India’s projected GDP deceleration and muted earnings have added fuel to the fire.
- Algorithmic selling: Breaches of key technical levels have led to rapid, momentum-driven declines
Opportunity or Trap?
No one can call a market bottom with precision. But historically, buying during sharp drawdowns has offered a favorable risk-reward — especially when fundamentals remain intact and domestic liquidity is strong.
With markets currently ~16% off recent highs and valuations near long-term averages, this correction may well be one of those moments — a time when discomfort creates opportunity.
"Be fearful when others are greedy, and greedy when others are fearful."
— Warren Buffett
If history is any guide, now may not be the worst time to start deploying capital — patiently, incrementally, and with a long-term lens.
Disclaimer: This article is based on data analysis and does not constitute investment advice. Investors should conduct their own research and consult with financial advisors before making investment decisions. Past performance is not indicative of future results.


