

HDFC Midcap Opportunities Fund: The Midcap Engine
A complete bottom-up analysis of India's largest Midcap fund.


In an Indian equity landscape often dominated by large-cap heavyweights,
HDFC Midcap Opportunities Fund has carved a distinctive niche, demonstrating that the road less traveled through India's midcap universe can deliver exceptional returns for patient investors. Our analysis spanning January 2013 to April 2025 reveals a compelling picture of outperformance that warrants closer scrutiny by serious market participants.
Outperformance Trajectory: Widening Gap Over Time
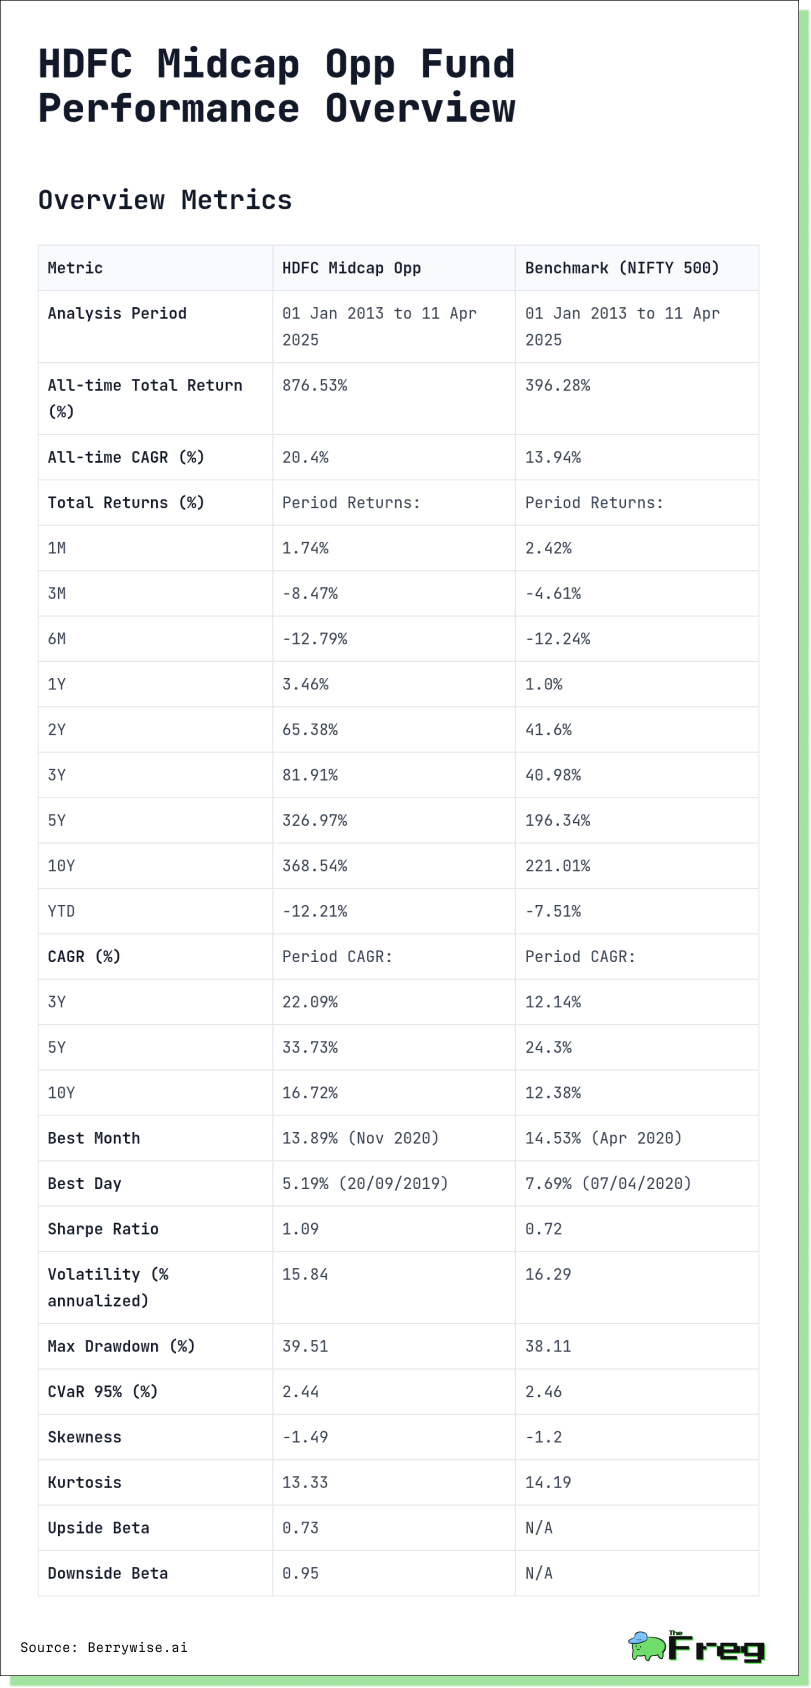
The fund has delivered a staggering 876.53% total return over the full analysis period of 12.27 years, handily outpacing the NIFTY 500 benchmark's 396.28%. This translates to an all-time CAGR of 20.4% versus the benchmark's 13.94% - a performance gap that compounds dramatically for long-term investors, resulting in 2.21x the wealth creation of the broader market.
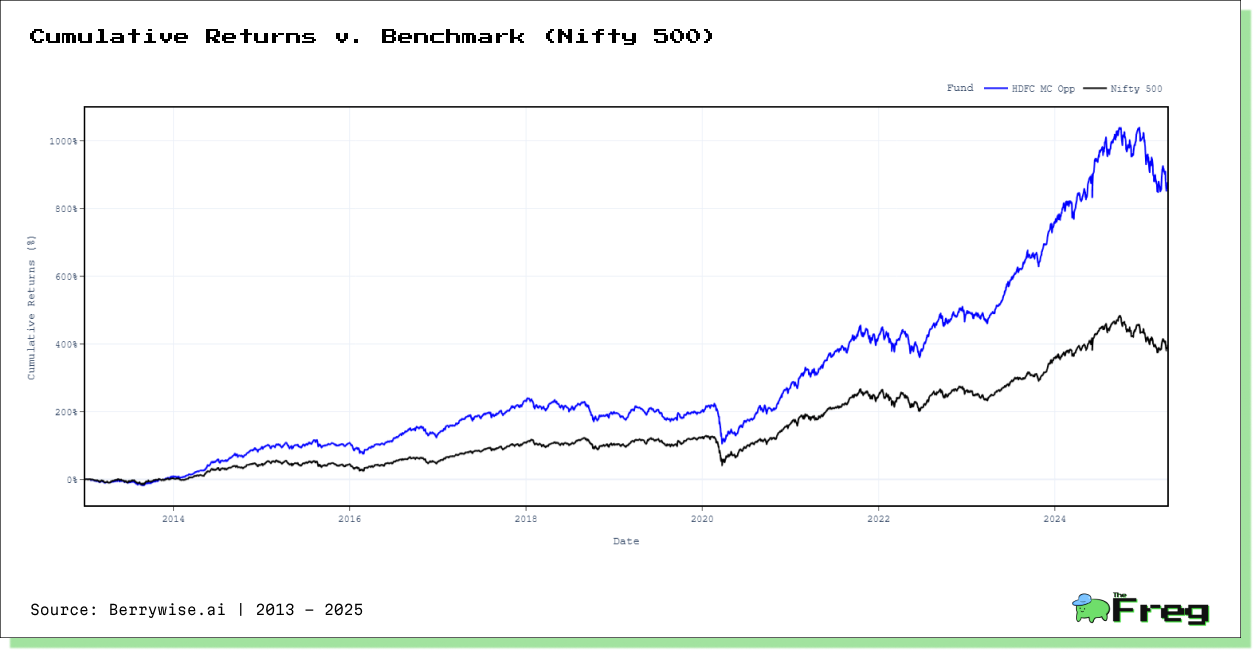
Even looking at a shorter 10-year timeframe, the fund maintains its impressive outperformance with a 368.54% return versus the benchmark's 221.01%. Most revealing is the fund's acceleration of outperformance over more recent time frames. The 5-year CAGR stands at an extraordinary 33.73%, towering over the benchmark's 24.3%. This widening performance gap suggests the fund's strategy has found particular resonance in India's evolving midcap landscape.
The Compounding Effect: Early Years' Critical Contribution
Our period analysis reveals the mathematical basis behind the fund's remarkable all-time performance. The initial 2.27 years of the fund's history (January 2013 to April 2015) delivered an exceptional 107.89% return—a phenomenal 38.05% CAGR that significantly outpaced the benchmark's 55.07% return (21.32% CAGR) during the same period.
This early period featured an extraordinary second year (2014) when the fund returned 77.89%, coinciding with the market euphoria following the first Modi administration.
This compounding effect illustrates a fundamental investment truth: exceptional early-period returns, even over a relatively brief timeframe, can dramatically amplify long-term results when given sufficient time to compound. For long-term investors in the fund since inception, those initial 2.27 years effectively doubled the wealth creation compared to investors who entered at the 10-year mark.
Anatomy of Outperformance: The Power Years
Four standout years—2014, 2017, 2021, and 2023—contributed a combined
17.83 percentage points to the fund's overall CAGR, effectively powering the engine of its long-term outperformance.
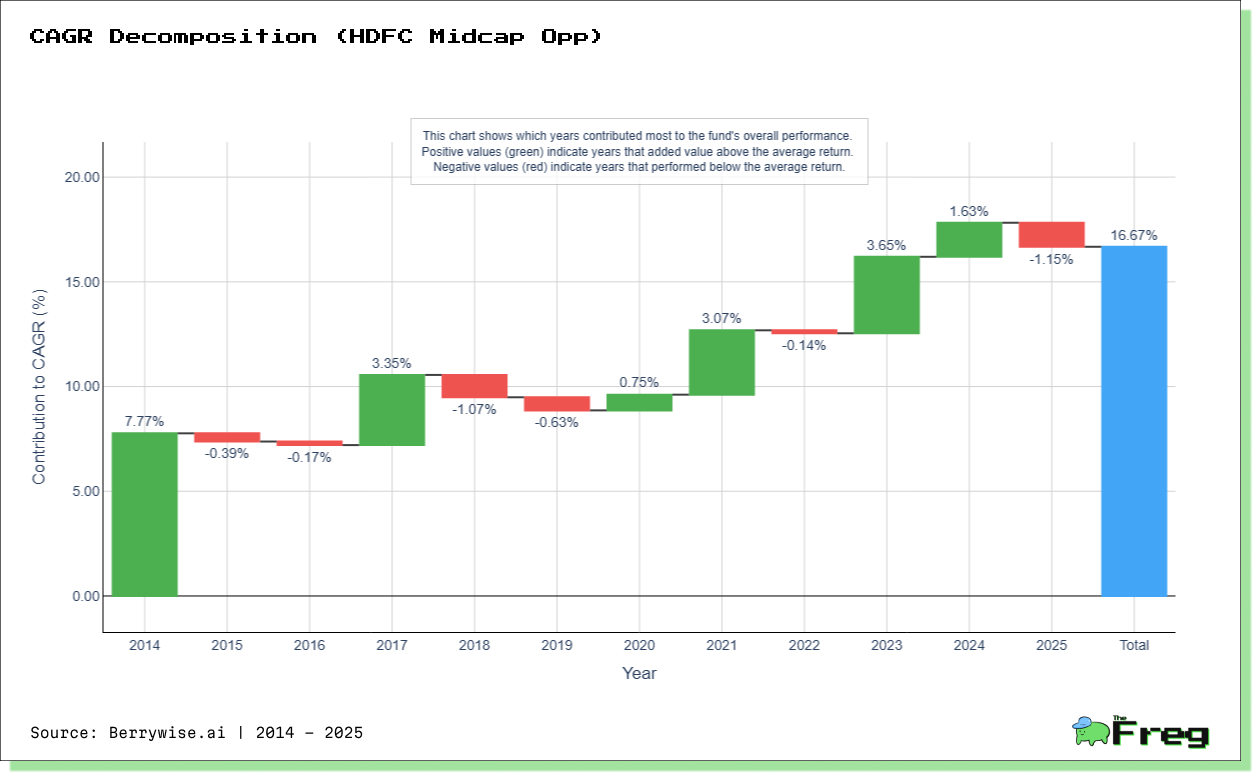
The most remarkable contribution came in 2014 when the fund delivered a staggering 77.85% return, adding 7.77 percentage points to the overall CAGR—nearly half of the fund's total 16.67% CAGR in a single year. This exceptional performance coincided with the early euphoria of the Modi administration's first term, when midcap valuations expanded dramatically on expectations of economic reform.
Equally revealing are the periods that detracted from performance. The challenging market environments of 2018 and 2025 (YTD) subtracted 1.07 and 1.15 percentage points respectively from the CAGR. The 2018 drawdown—coinciding with a broad midcap correction in India—proved particularly testing for the fund's growth-focused strategy, though this setback was more than compensated by subsequent contributions.
This granular decomposition underscores a critical insight: the fund's outperformance isn't evenly distributed across time but concentrated in particular market environments where its growth-oriented, quality-focused strategy finds its sweet spot.
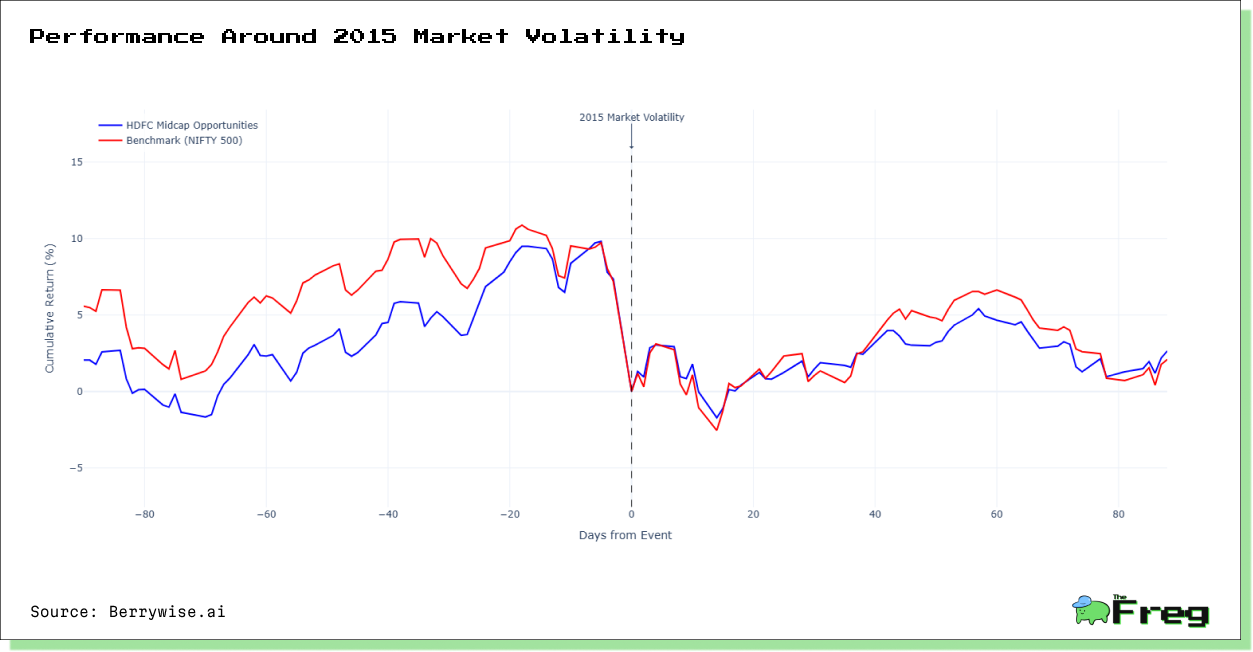
Crisis Period Performance: Selective Resilience
Our examination of HDFC Midcap Opportunities Fund's behavior during five major market stress periods reveals a nuanced picture of its defensive capabilities. The fund has displayed selective resilience—outperforming the NIFTY 500 benchmark in three out of five crisis periods, albeit with an average underperformance of 0.79% across all analyzed crises.
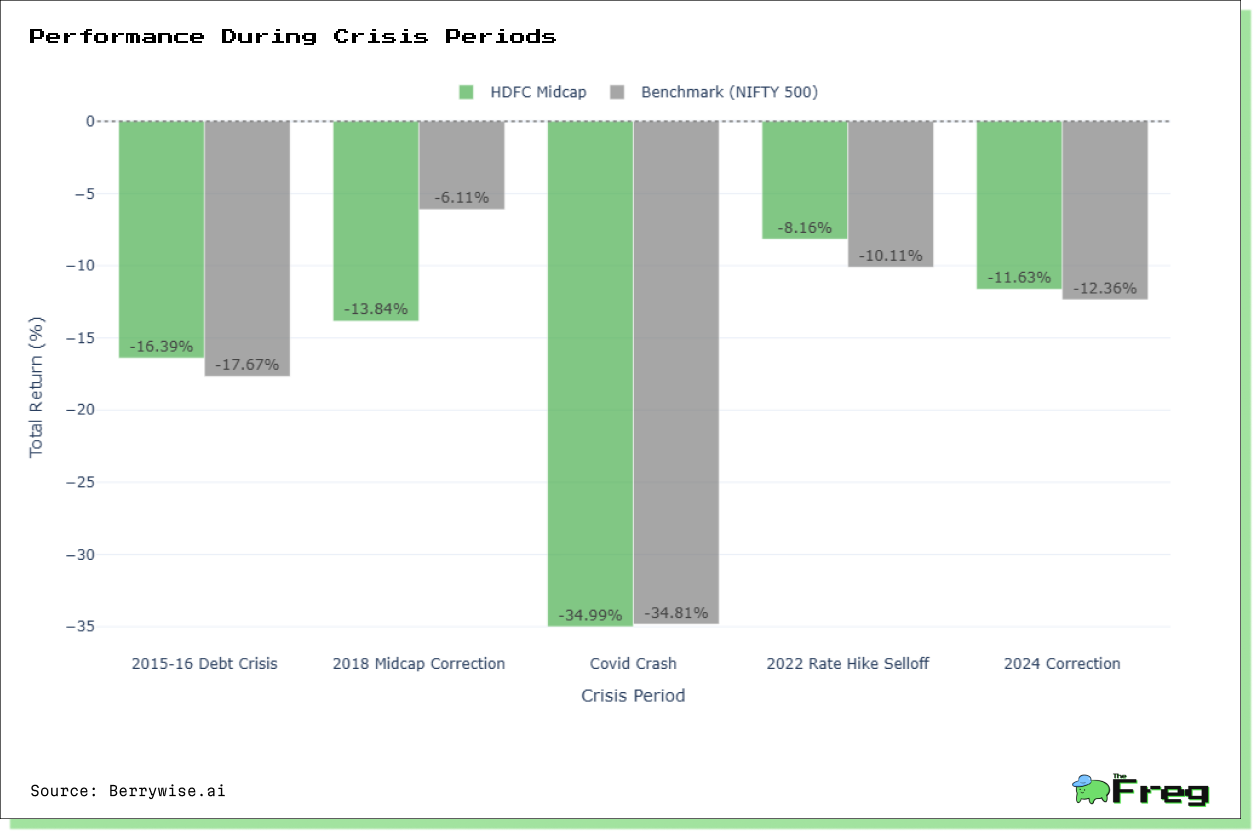
The fund demonstrated notable relative strength during the 2015-16 Debt Crisis (outperforming by 1.27%), the 2022 Rate Hike Selloff (outperforming by 1.94%), and the 2024-25 Correction (outperforming by 0.72%). This pattern suggests a particular advantage during interest rate-related market dislocations, potentially attributable to the fund's quality bias and focus on companies with strong balance sheets.
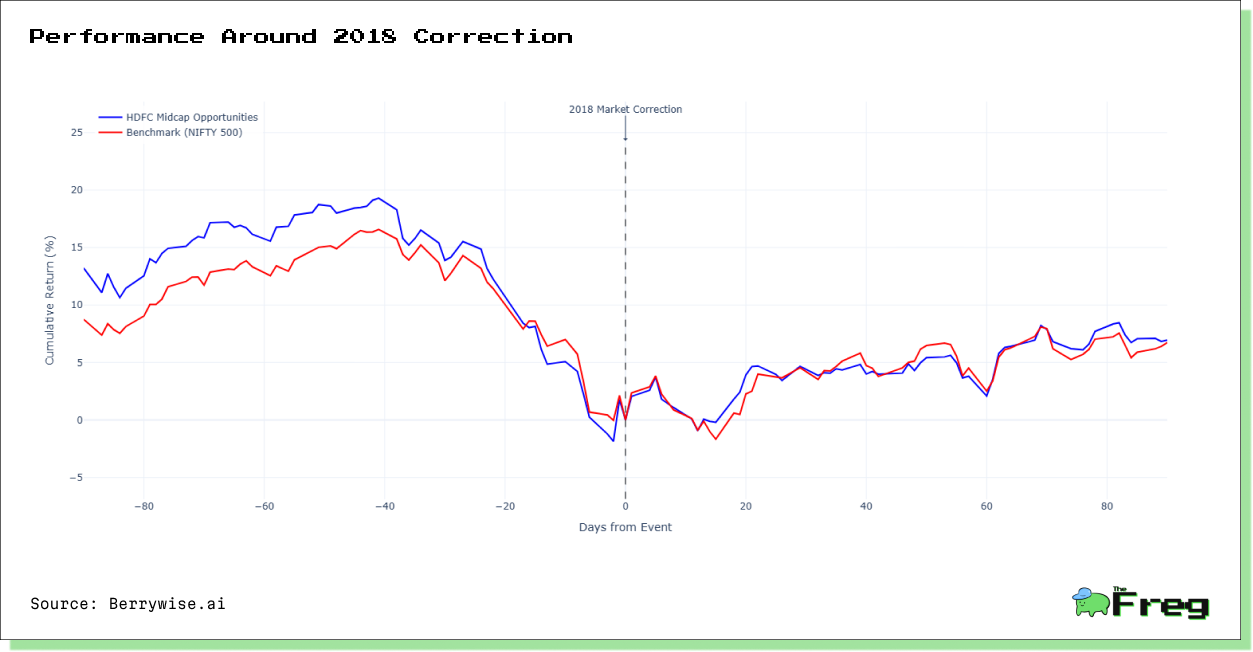
However, the fund's midcap orientation proved a vulnerability during the 2018 Midcap Correction, where it underperformed the broader market by a
substantial 7.73%. This period represented a distinct challenge for the midcap segment broadly, as the category experienced a significant de-rating after several years of outperformance.
What's particularly revealing is the consistency of the fund's relative performance during the most recent crisis periods. Since 2020, the fund has either outperformed or closely tracked the benchmark during market downturns, suggesting a possible evolution in its risk management approach following the lessons of the 2018 midcap correction.
Event Navigation: The Art of Crisis Management
A granular analysis of the fund's behavior during key market events provides insights into its crisis management capabilities. Our examination of seven critical market inflection points between 2013 and 2025 reveals a consistent pattern in the fund's tactical approach.
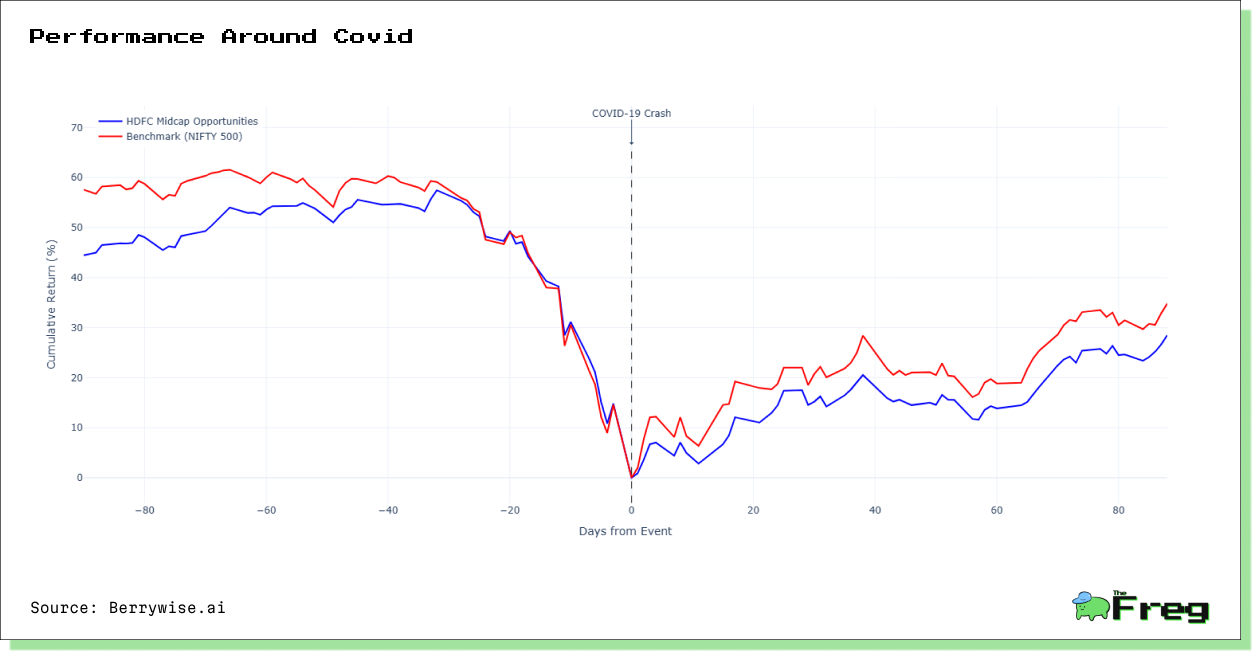
During the COVID-19 market crash of March 2020, HDFC Midcap Opportunities demonstrated noteworthy defensive positioning, declining 20.52% versus the benchmark's steeper 27.26% drop—generating 6.74% of alpha during the pre-crisis buildup. However, this pattern reversed in the recovery phase, with the fund underperforming the benchmark by 4.84% in the 90 days following the crisis trough. This asymmetric pattern—outperformance during declines followed by initial lag in recoveries—represents a defining characteristic of the fund's event navigation.
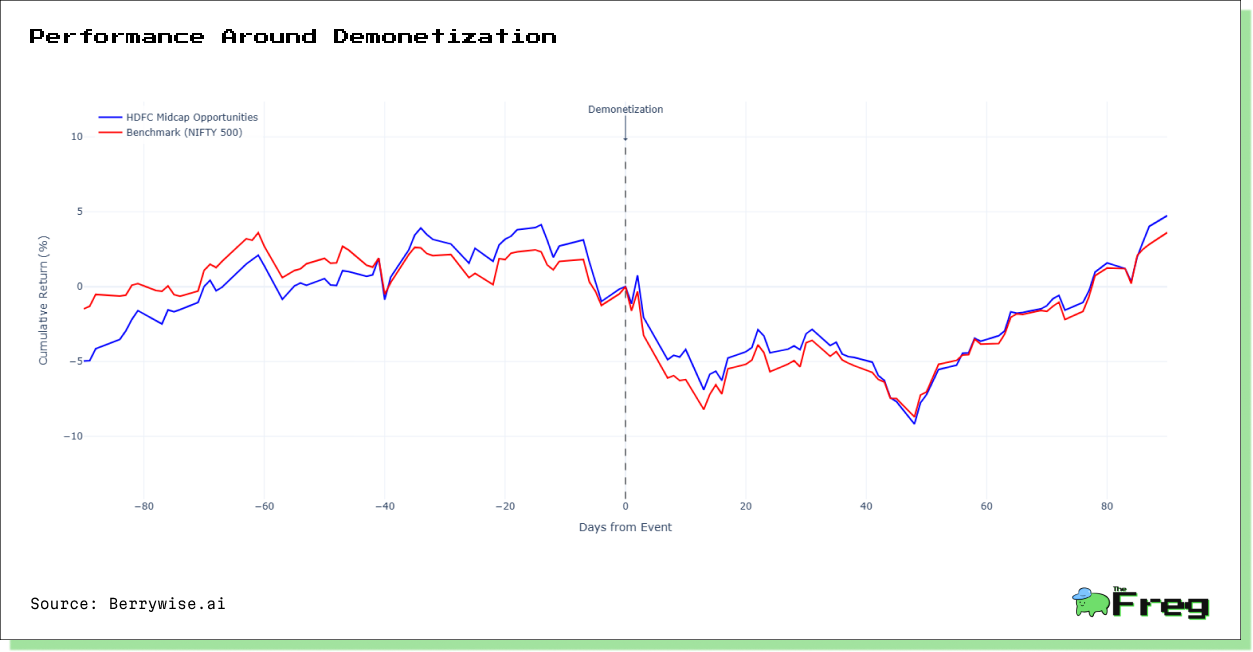
The fund's navigation of India's November 2016 demonetization event offers a contrasting example of resilience during domestic policy shocks. Prior to this black swan event, the fund had already outperformed the benchmark by 4.04% in the preceding 90 days. In the immediate aftermath, the fund demonstrated remarkable resilience—outperforming the benchmark in the first week
(-0.92% versus -1.67%) and maintaining this outperformance through the entire 90-day post-event period.
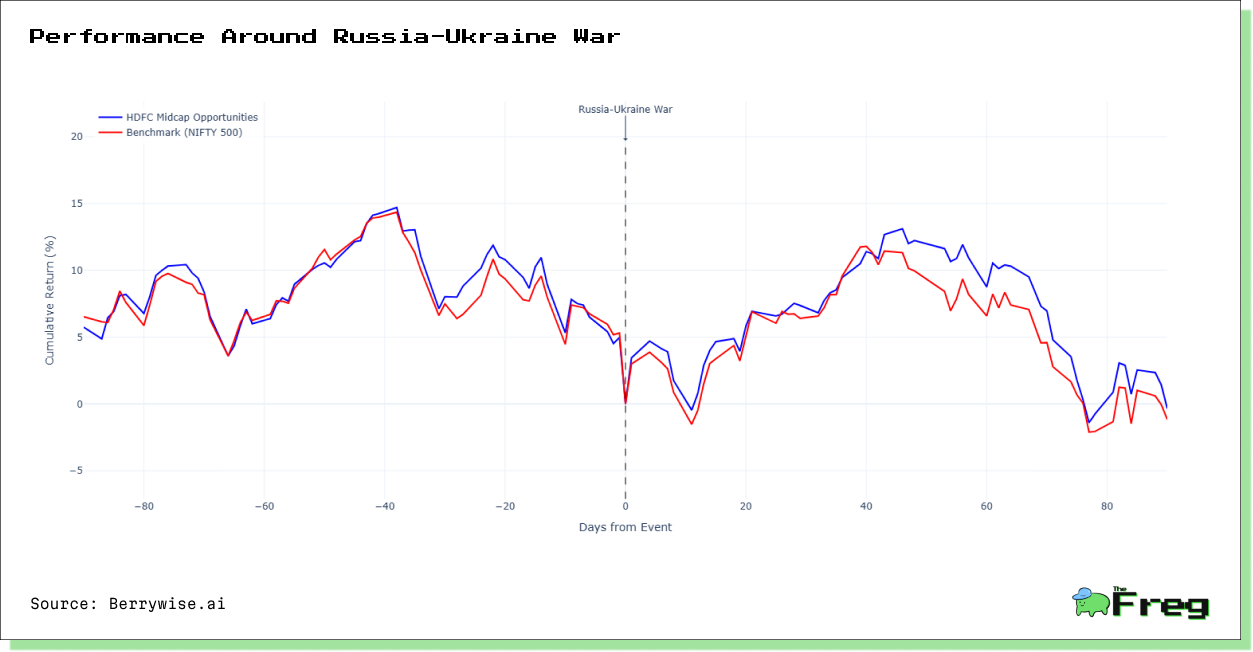
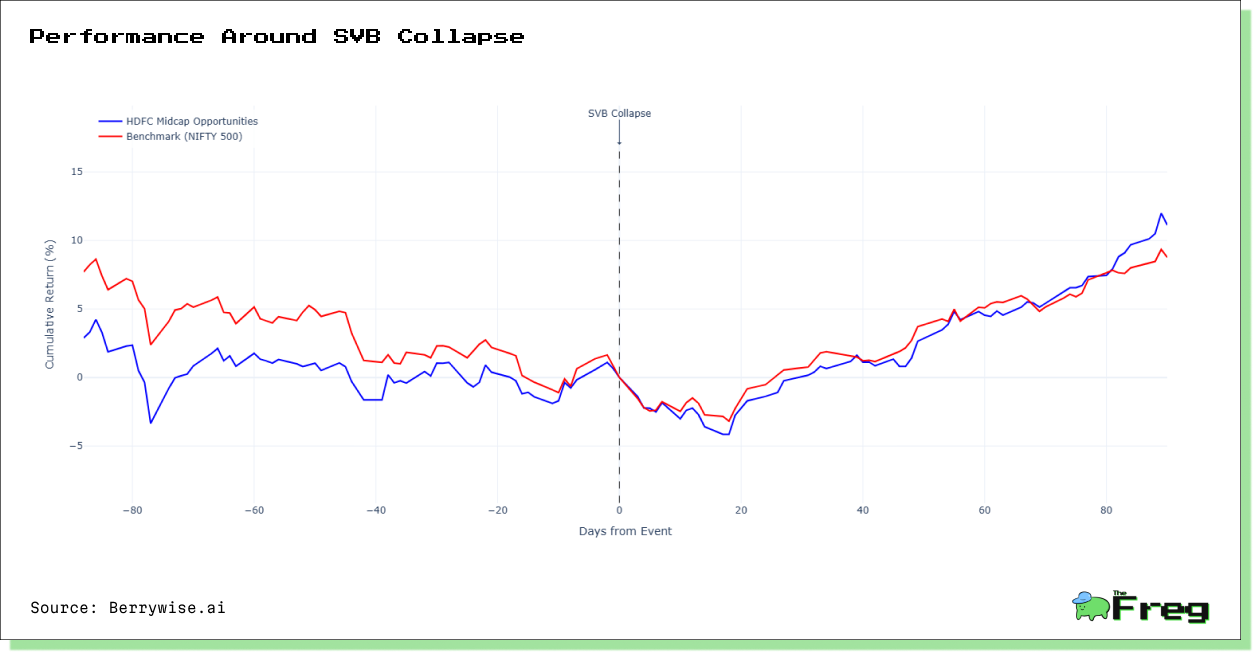
More recent crisis events suggest an evolution in the fund's event navigation capabilities. During both the SVB Collapse (2023) and Russia-Ukraine War (2022), the fund demonstrated substantial outperformance in both pre-event and post-event periods. This consistent pattern of outperformance during recent market shocks suggests meaningful evolution in the fund's risk management approach.
Risk-Return Profile: Asymmetric Upside Capture
With an annualized volatility of 15.84% compared to the benchmark's 16.29%, the fund has achieved its outperformance with marginally lower volatility - a notoriously difficult feat in the typically more volatile midcap segment.
This efficiency is reflected in the fund's superior Sharpe ratio of 1.09 versus the benchmark's 0.72, indicating significantly better risk-adjusted returns. Our risk metrics analysis provides further insight into the fund's risk management prowess. With a Value-at-Risk (VaR) of -6.09% at the 95% confidence level, investors can expect monthly losses to exceed this threshold only 5% of the time.
The more conservative Conditional Value-at-Risk (CVaR) of -10.65% offers a clearer picture of tail risk, representing the expected loss when those worst-case scenarios materialize. The fund's Entropic Value-at-Risk (EVaR) of -11.31% provides an alternative measure accounting for the distribution's shape.
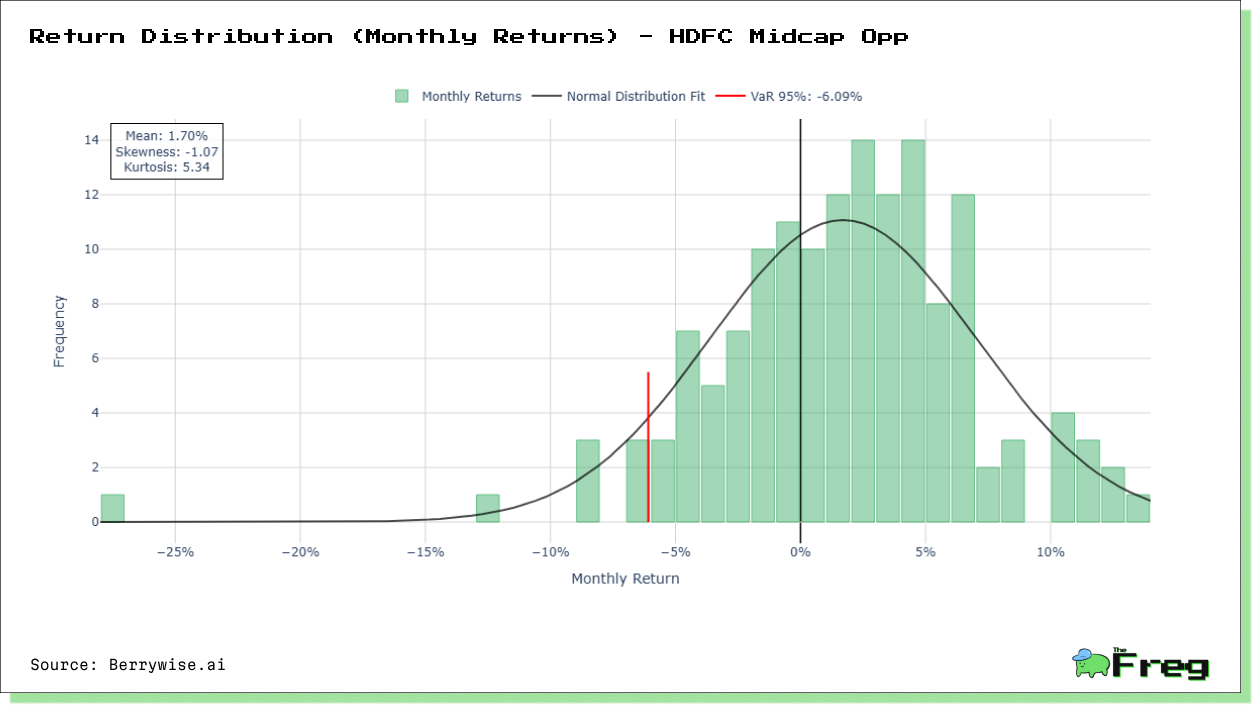
The return distribution exhibits negative skewness (-1.07) and high kurtosis (5.34), indicating more frequent small gains punctuated by less frequent but larger losses—a common pattern for growth-oriented strategies in the midcap space. Despite this asymmetry, the fund maintains an impressive mean monthly return of 1.70% with a standard deviation of 5.33%, delivering a compelling return-to-risk proposition for long-term investors.
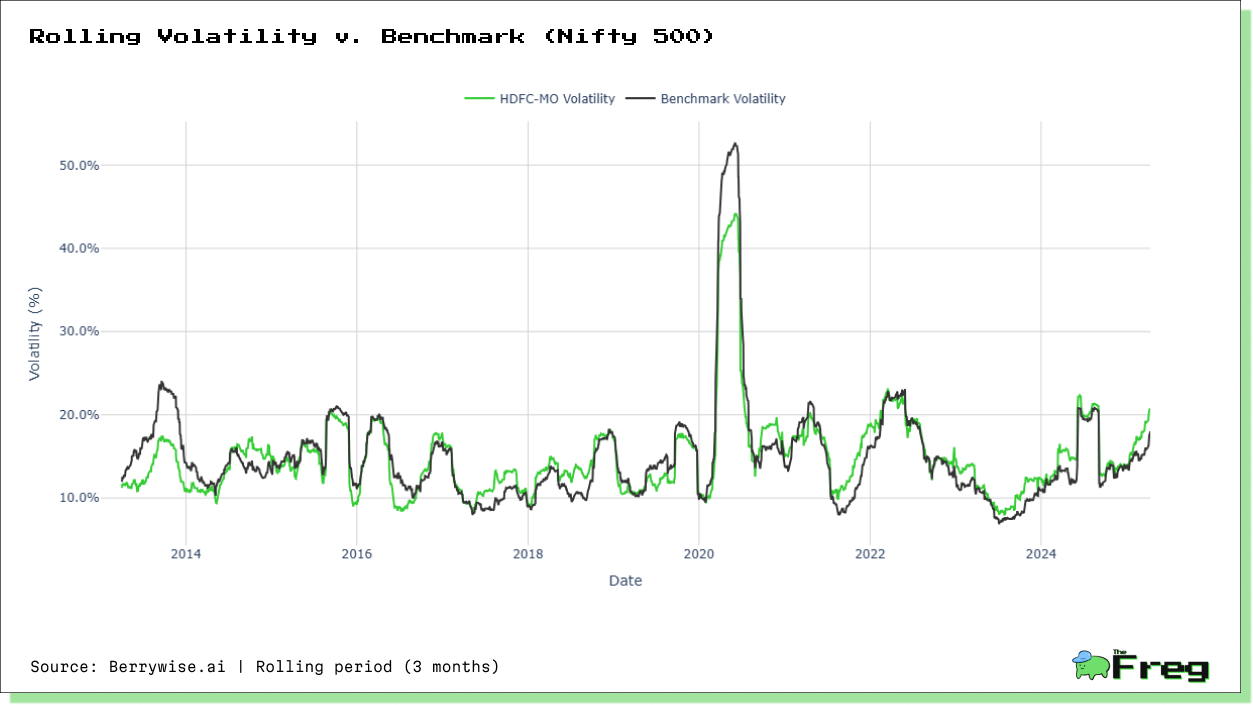
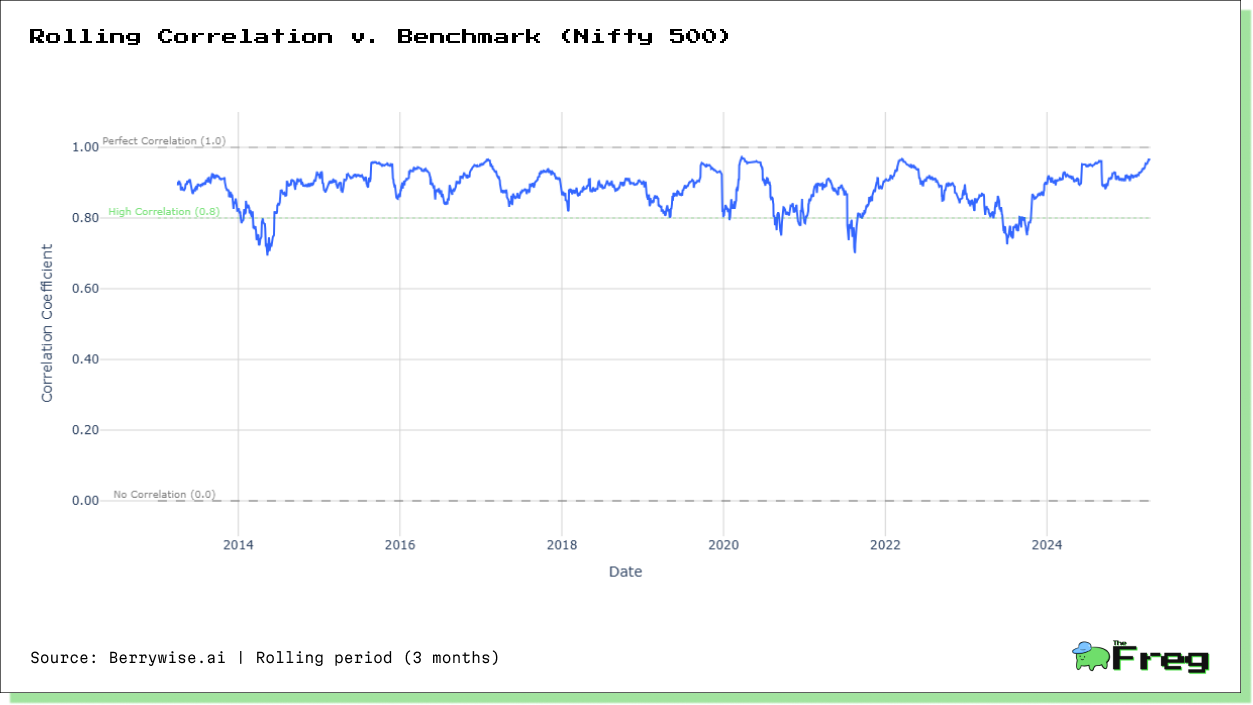
The fund's rolling volatility and correlation analysis reveals another dimension of its risk management approach. During periods of market stress, such as the 2020 pandemic crash, the fund's volatility typically increases in tandem with the benchmark, but with a tendency to recover more quickly during stabilization phases. Its rolling correlation to the benchmark fluctuates meaningfully—ranging from below 0.7 during sector rotation periods to above 0.9 during broad market movements—suggesting tactical positioning rather than simple benchmark tracking.
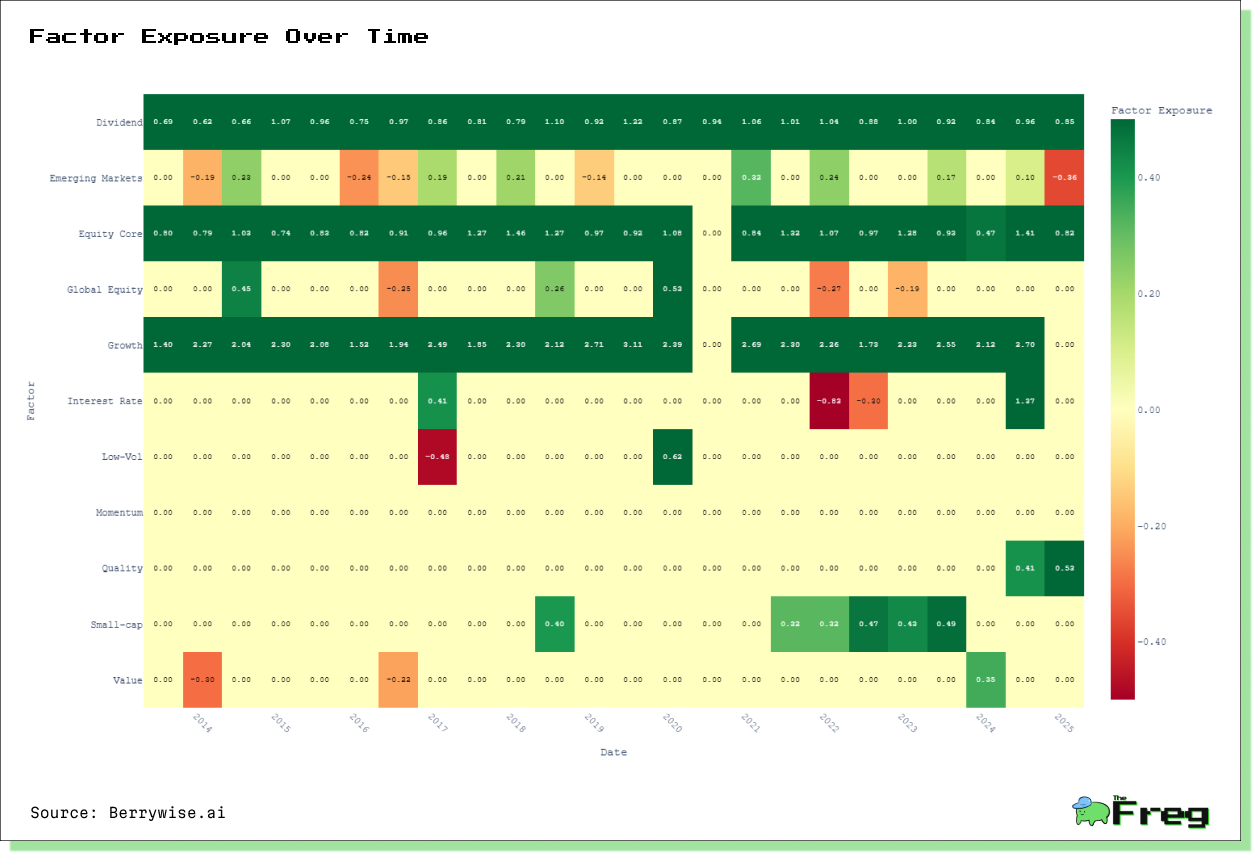
Factor Exposures: Growth Engine with Quality Underpinnings
Our factor analysis reveals the DNA behind the fund's outperformance. HDFC Midcap Opportunities exhibits a pronounced exposure to Growth (2.14), establishing it firmly as a growth-oriented investment vehicle. This dominant growth tilt explains much of the fund's stellar performance during India's extended bull run, particularly in the midcap segment where growth premiums have expanded significantly.
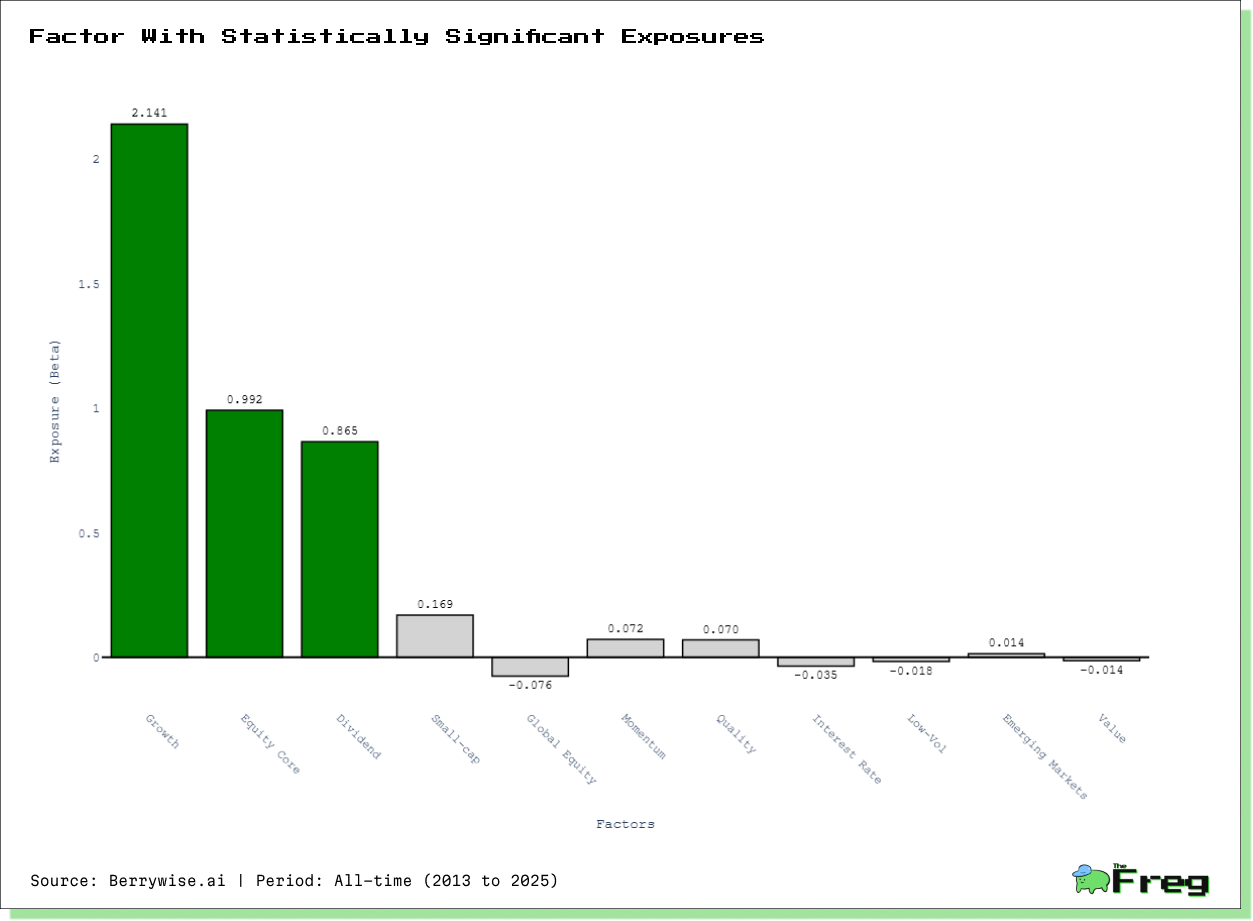
The fund also maintains substantial positive exposures to Equity Core (0.99) and Dividend (0.87) factors. This triad of exposures paints a nuanced picture of the fund's approach: a core growth orientation balanced by quality companies with stable dividend histories—a combination that has proven particularly potent in India's maturing equity markets.
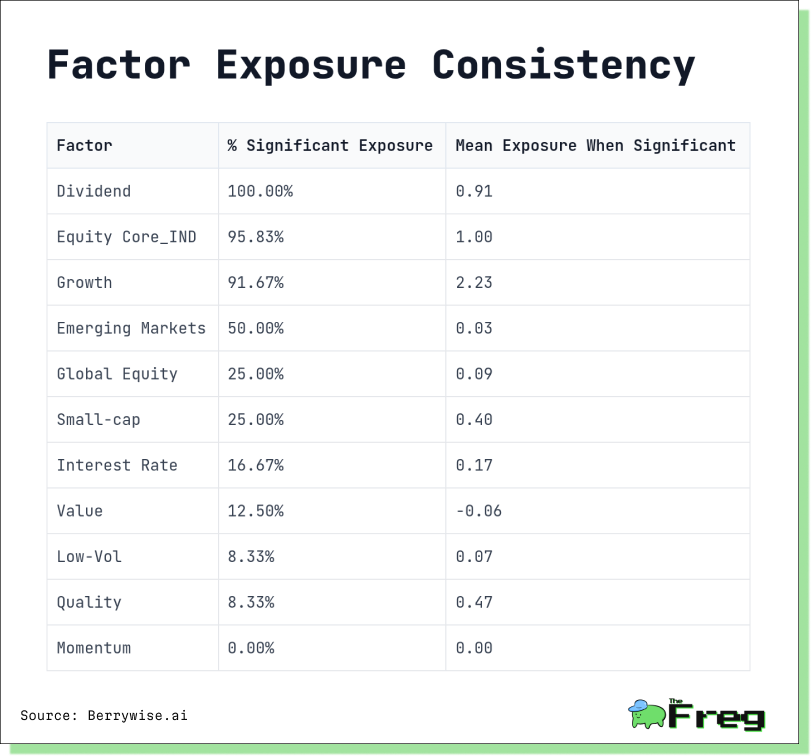
What truly distinguishes HDFC Midcap Opportunities' approach is not merely its factor exposures, but their remarkable consistency. Our time-series analysis reveals that the fund has maintained significant exposure to Dividend
(100% of periods), Equity Core (95.83%), and Growth (91.67%) factors across nearly all market regimes since 2013. This unwavering commitment to its core strategy suggests a disciplined investment approach rather than opportunistic style drift.
While the fund's core exposures have remained consistent, our granular time-series analysis reveals subtle yet strategic adaptations to changing market environments. During the 2015-2016 period of heightened volatility, the fund incrementally increased its Growth exposure from 2.08 to 2.49, effectively doubling down on its core strategy during market uncertainty. Similarly, in the post-pandemic recovery phase (2020-2021), the fund strategically increased its Small-cap factor exposure from negligible levels to 0.32-0.47, suggesting a tactical tilt toward smaller, higher-beta names to capture the early stages of market recovery.
Drawdown Dynamics: The Recovery Equation
HDFC Midcap Opportunities experienced a maximum drawdown of 39.51%, marginally worse than the benchmark's 38.11%. However, the fund has shown greater discipline in avoiding moderate drawdowns, experiencing only 6 drawdowns exceeding 10% compared to the benchmark's 9 such episodes.
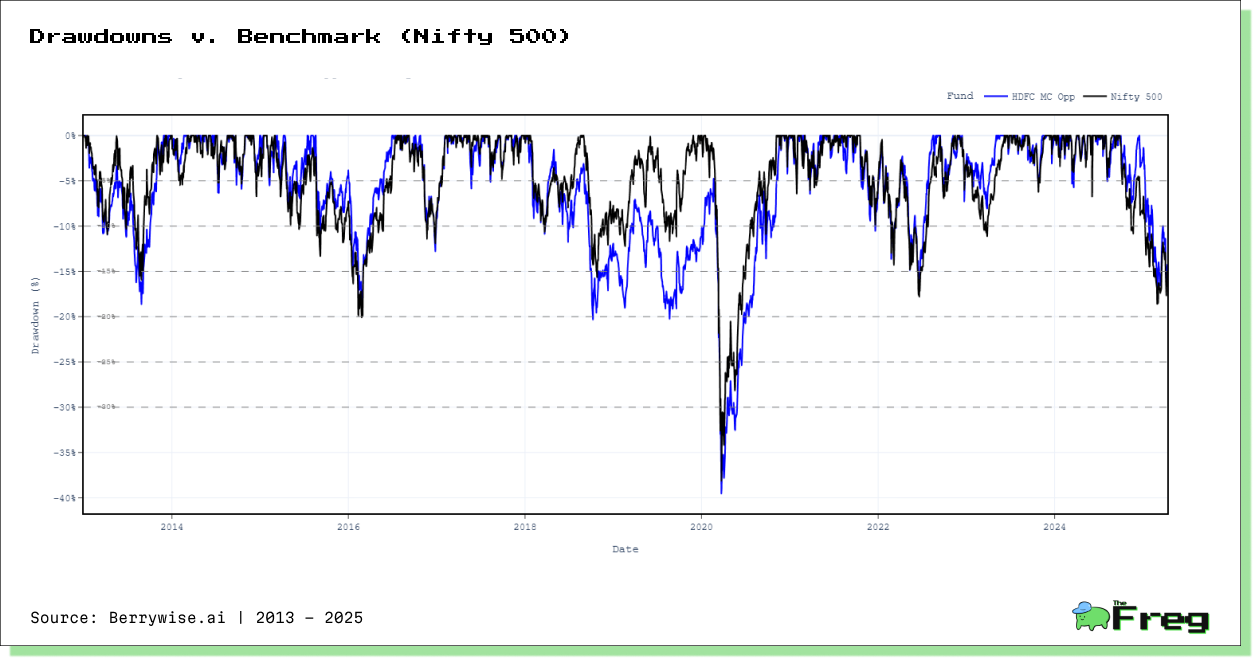
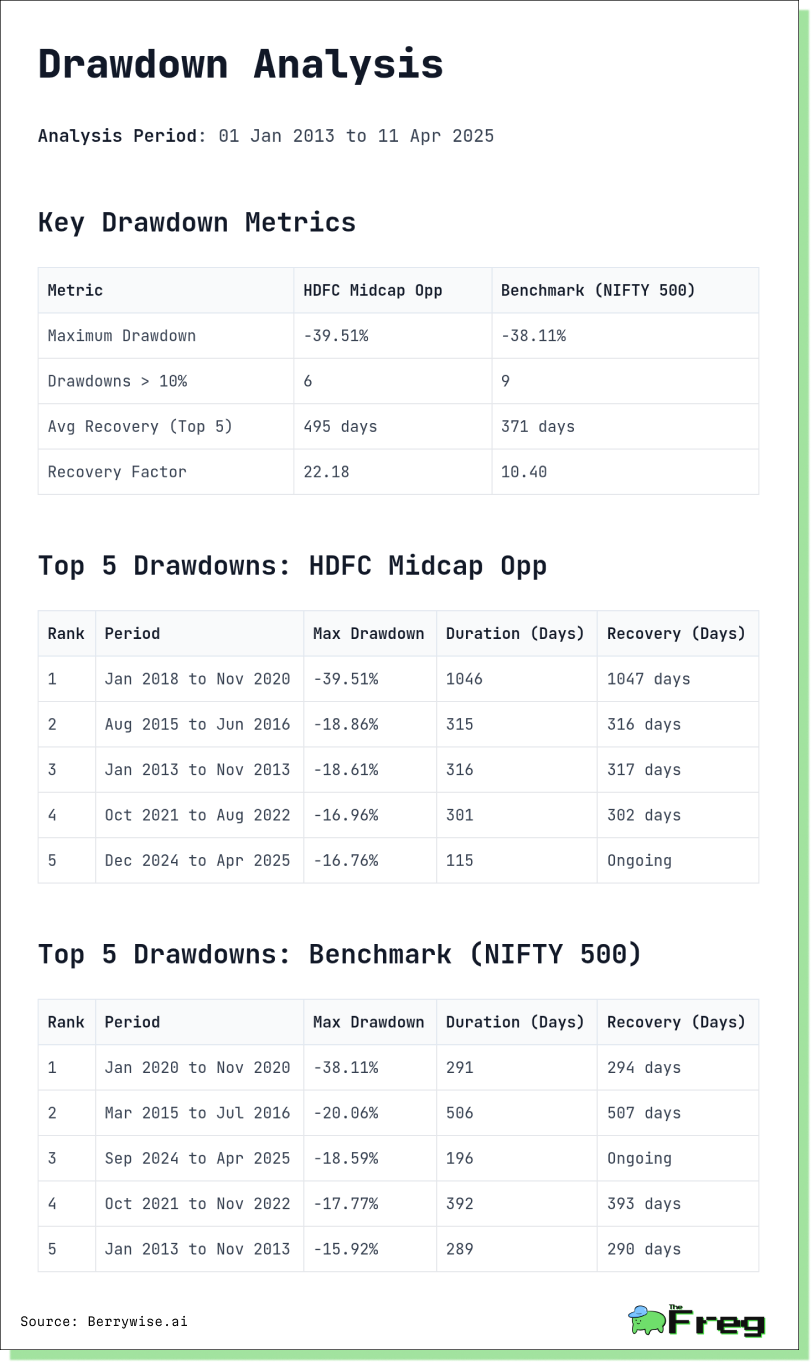
While the average recovery period for its top 5 drawdowns (495 days) exceeds the benchmark's (371 days), its recovery factor of 22.18 dwarfs the benchmark's 10.40. This suggests that although the fund may take longer to recover from drawdowns, the magnitude of subsequent returns more than compensates for the waiting period.
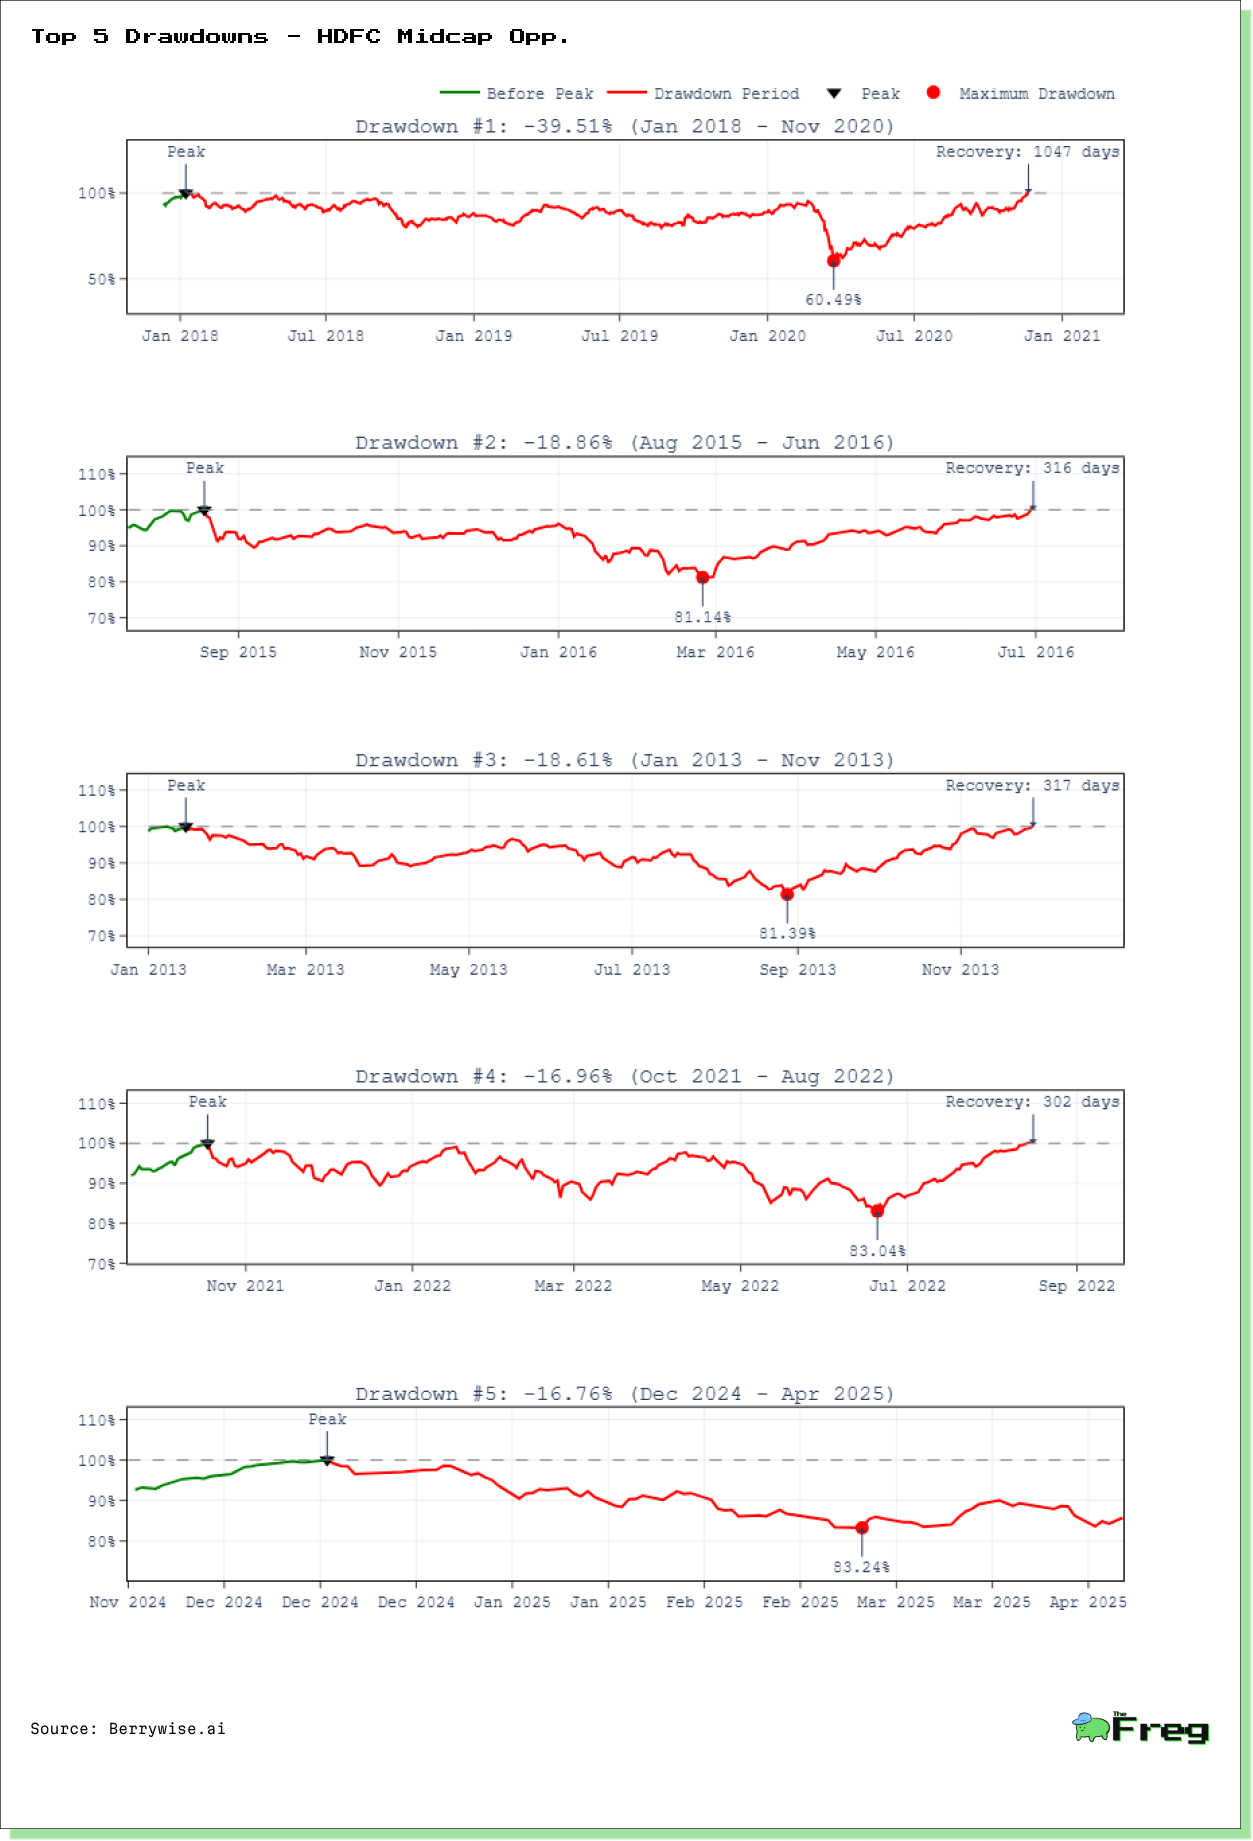
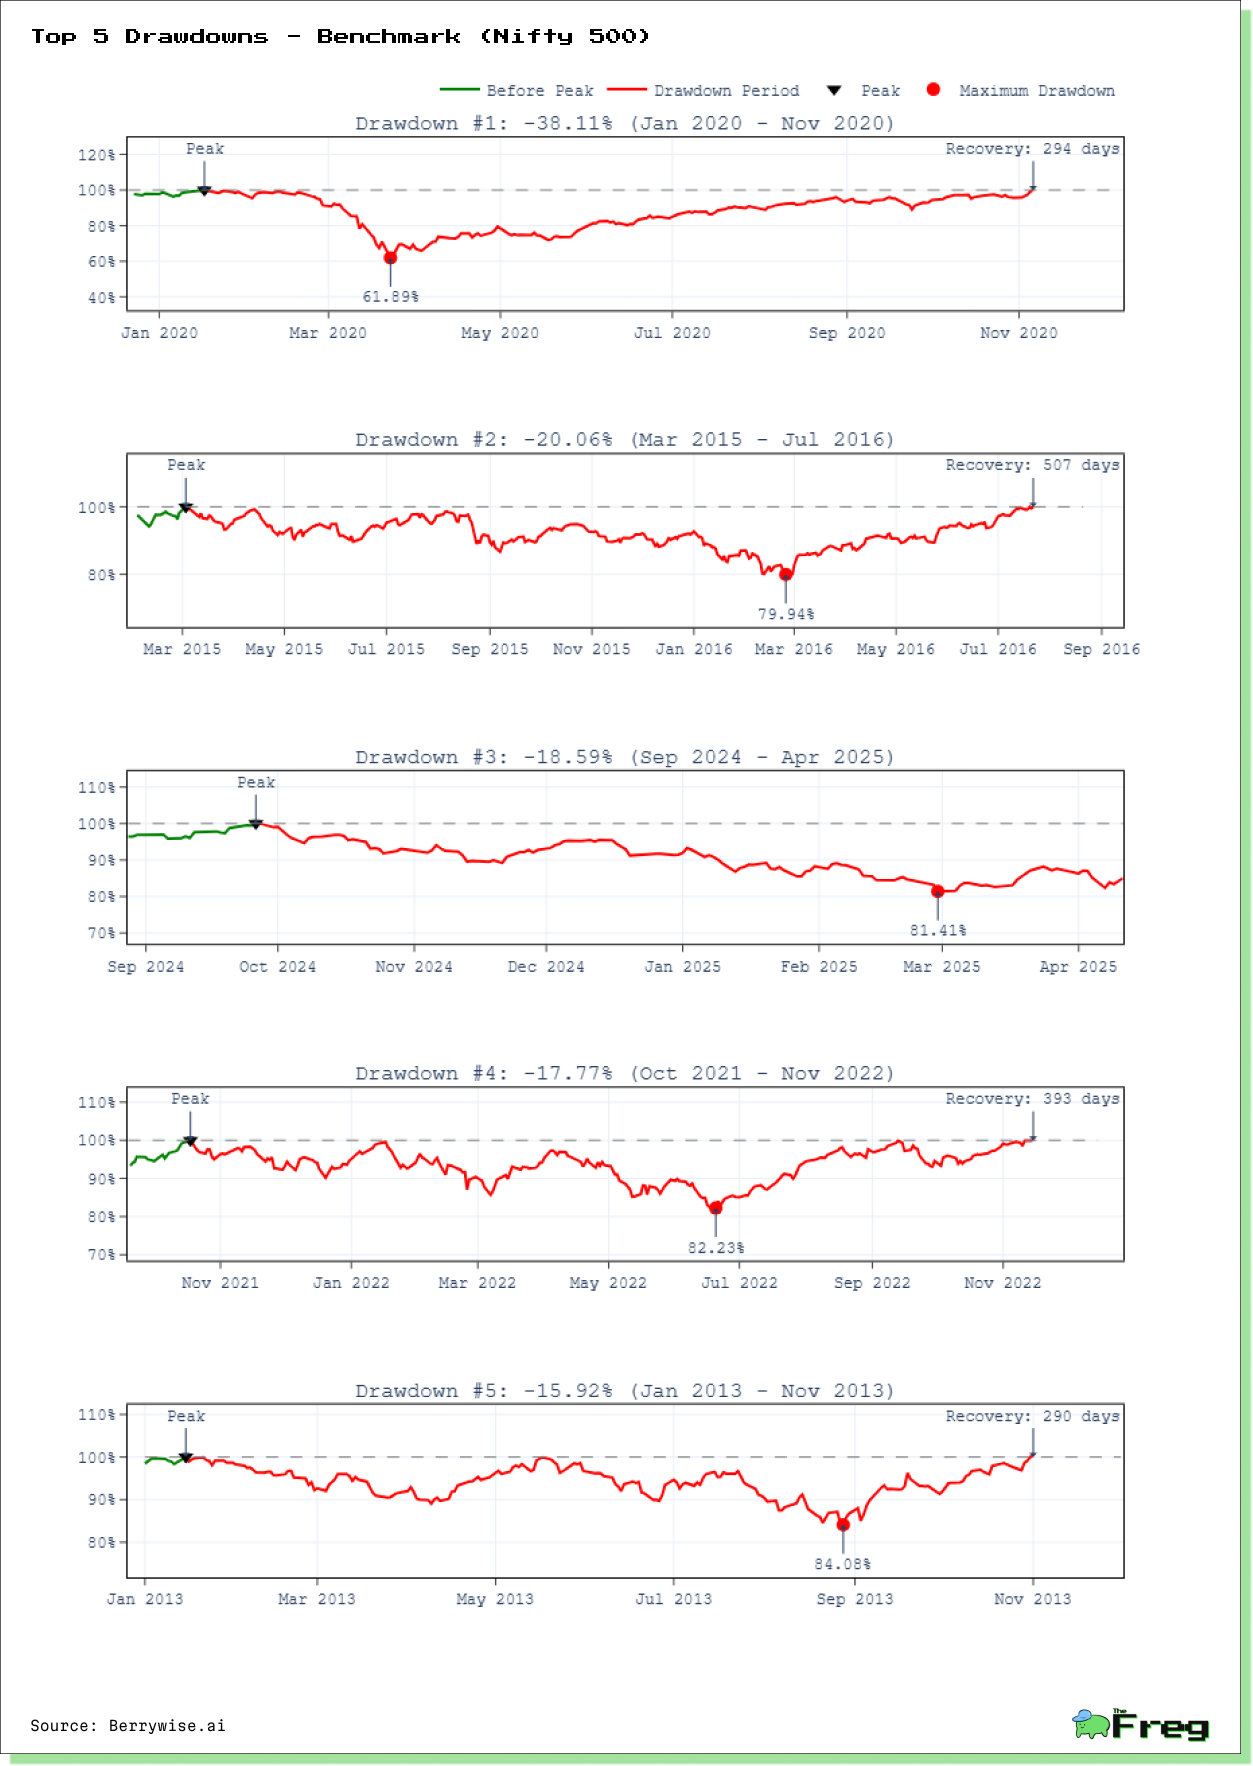
Our drawdown factor analysis reveals a consistent pattern: during drawdown periods, the fund's pronounced Growth exposure has typically acted as a double-edged sword, occasionally amplifying initial declines. However, throughout every major drawdown, Dividend exposure has remained consistently positive and substantial, providing downside cushioning.
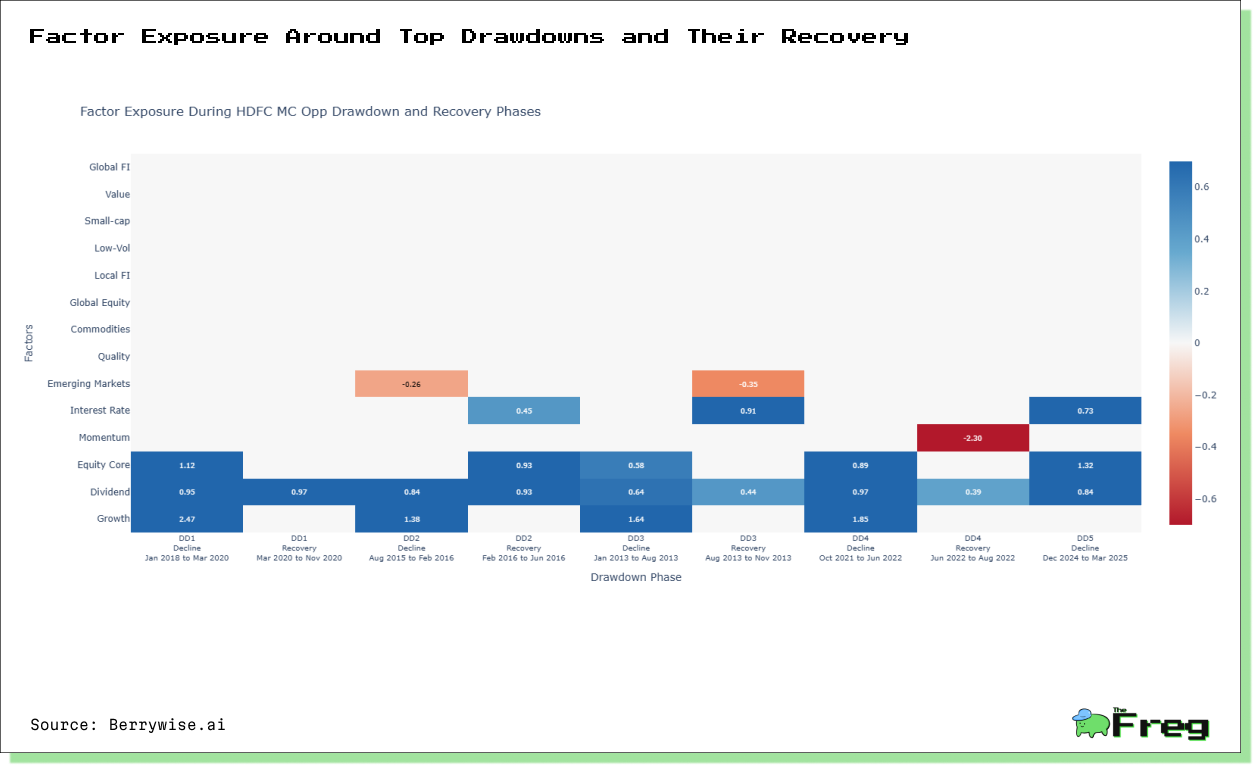
Most telling is the fund's behavior during recovery phases. In the post-pandemic bounce, the fund's factor exposures shifted notably, with Quality emerging as a significant driver alongside Dividend. The fund's most rapid recovery—a mere
57 days following the 2022 drawdown—featured an intriguing combination of Quality, Dividend, and Momentum factors, suggesting tactical agility when market conditions warrant.
This consistent pattern—maintaining core Growth and Dividend exposures during declines while selectively adding Quality exposure during recoveries—illustrates the investment team's disciplined approach to navigating market cycles.
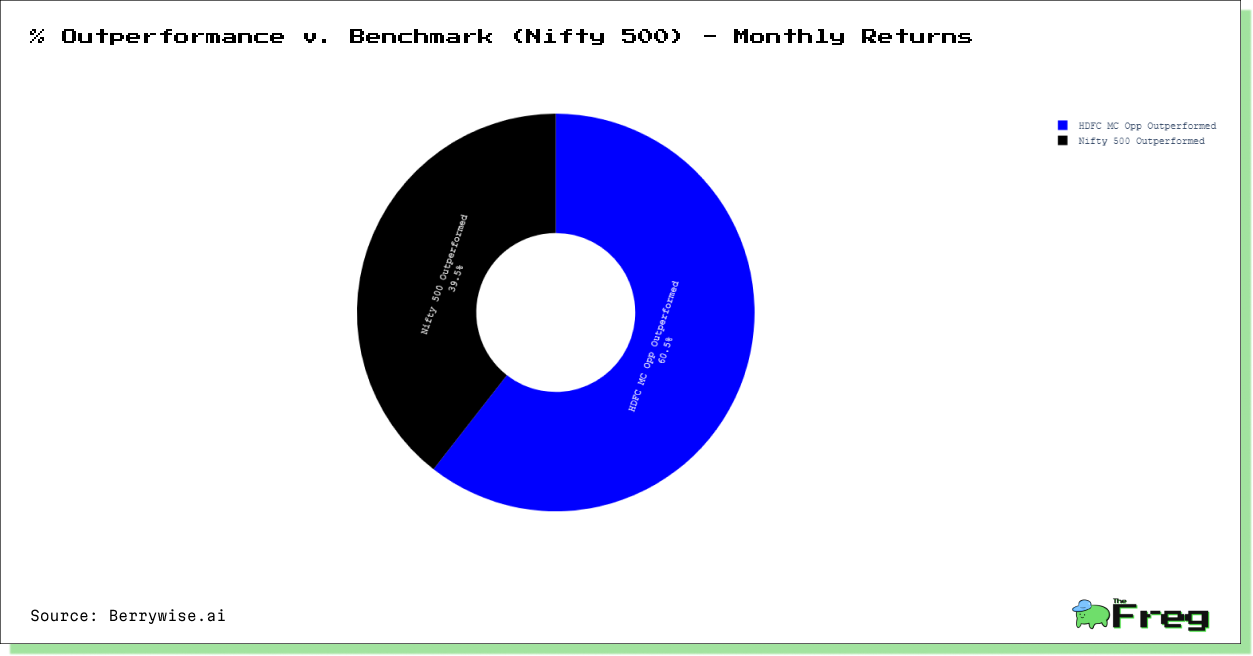
Calendar Performance: Consistency Through Market Cycles
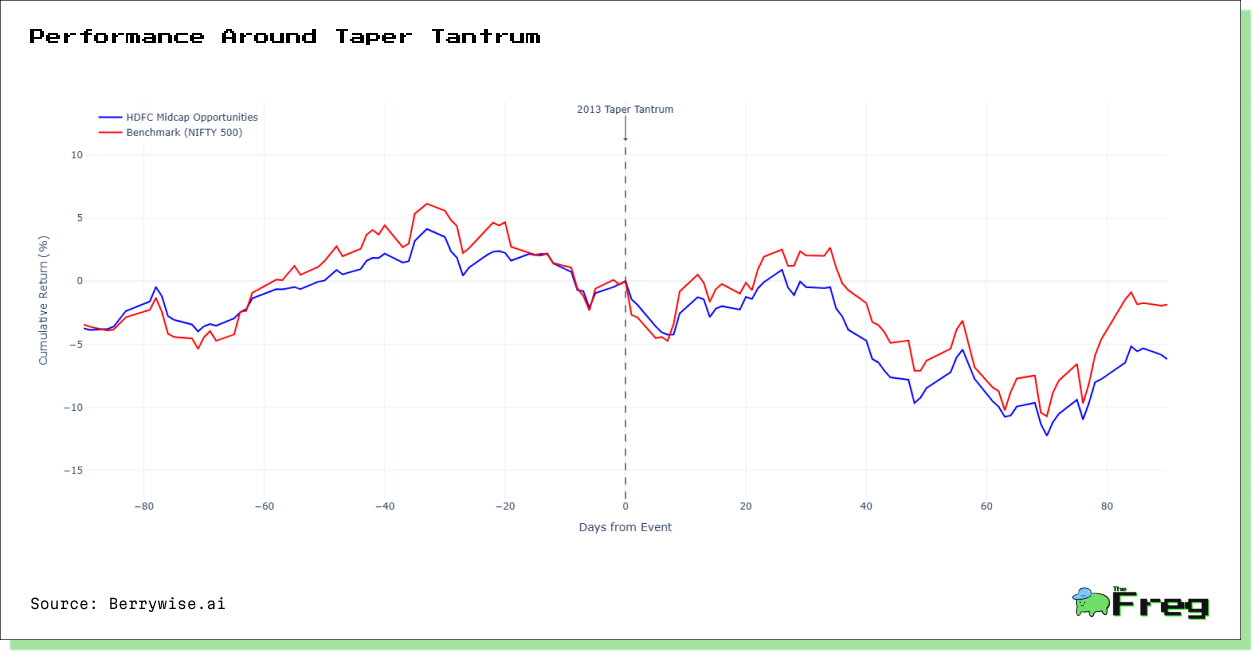
The fund's month-by-month performance record shows remarkable consistency, outperforming the benchmark in 60.54% of months during the analysis period. This consistency has been maintained across different market regimes, from the taper tantrum of 2013 to the pandemic crash of 2020 and subsequent recovery.
Particularly noteworthy is the fund's behavior during extreme market environments. During the COVID-induced market crash, the fund's 13.89% return in November 2020 helped drive recovery, demonstrating its ability to capitalize on market dislocations. Similarly, its best single-day performance of 5.19% (September 20, 2019) came during a period of significant market rotation.
Conclusion: The Midcap Advantage
For investors willing to withstand periodic volatility and longer recovery periods, HDFC Midcap Opportunities Fund offers a compelling proposition - access to India's midcap growth story through a disciplined investment approach that has consistently delivered superior long-term returns.
The fund's performance signature suggests it is most suitable for investors with at least a 5-year horizon, where its superior CAGR (33.73% versus benchmark's 24.3%) can meaningfully compound wealth. With an all-time CAGR of 20.4% over 12.27 years—translating to a remarkable 876.53% total return versus the benchmark's 396.28%—and a 10-year return of 369.72% (versus benchmark's 220.04%), the fund has demonstrated its ability to create substantial wealth over various market cycles.
The analysis underscores the power of early investment and compounding—the fund's exceptional performance during its first 2.27 years (107.89% return) effectively doubled the wealth creation of the entire 12-year period compared to later entrants. This "early bird advantage" represents a critical lesson for investors: identifying promising funds early in their lifecycle can deliver outsized returns.
The recent short-term underperformance (YTD: -12.21% versus benchmark's -7.51%) may actually present an entry opportunity for long-term investors,
if historical recovery patterns hold. HDFC Midcap Opportunities' track record demonstrates the potential alpha generation available in India's midcap segment when navigated by a disciplined investment process - a reminder that sometimes the greatest opportunities lie not at the center of the market, but in its vibrant middle tier.
Disclaimer: This article is based on data analysis and does not constitute investment advice. Investors should conduct their own research and consult with financial advisors before making investment decisions. Past performance is not indicative of future results.


