

Nifty’s 200-DMA Slump: A Market Stuck Between History and Hesitation
The Nifty 50 has stayed below its 200-day moving average for 65 sessions—the longest stretch since the COVID crash. While the downturn reflects global and domestic pressures, historical patterns suggest a rebound could be on the horizon.


The Nifty 50 has now spent 65 consecutive trading sessions below its 200-day moving average (DMA)—a milestone that echoes past crises but with a distinctly modern undertone. Not since the COVID-19 crash has India’s flagship index lingered so long under this critical technical indicator, a line often seen as the boundary between long-term bullishness and bearish doubt.
While the breach has raised eyebrows, it’s the historical parallels—and the lack of panic—that make this particular slide worth watching.
A Historical Perspective on 200-DMA Breaches
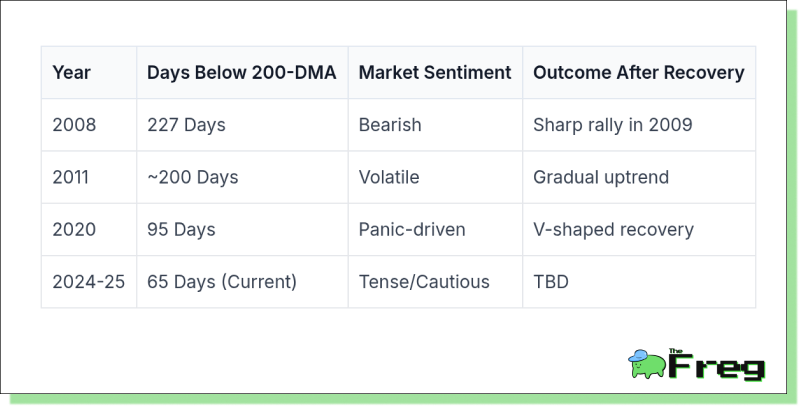
Looking back over the past quarter-century, only nine other instances rival the current slump in duration. The most infamous remains the 2008 financial crisis, when the Nifty languished below its 200-DMA for a staggering 227 days. That bear phase saw the index plunge as much as 45.3% below its long-term average before staging a historic comeback in 2009.
Other notable examples include the 2011 Eurozone crisis (~200 days), the COVID-19 crash (95 days), and now, the ongoing 2024–25 slide at 65 days—modest by comparison. Historically, during these prolonged downturns, the Nifty has traded at an average discount of 21.8% to its 200-DMA. The current deviation, at around 7%, feels more like a warning signal than a market meltdown.
The Technicals and the Takeaway
Though the index has struggled to reclaim its 200-DMA, history offers a mix of caution and optimism. Of the ten longest breaches, nine were followed by positive one-year returns, averaging a healthy +17.6%. That said, technical analysts are quick to note that breaching the 200-DMA doesn’t always lead to a crash—or a rally. It’s a signal of sentiment, not destiny.
Right now, Nifty is in a holding pattern. A relief rally is possible, a breakdown cannot be ruled out, and a sideways grind is perhaps the most likely short-term outcome. For now, resistance looms at the 23,900–24,000 range, and support hovers near 20,825—a mere 5.5% drop from current levels.
Macroeconomic Crosscurrents
Underpinning the market’s indecisiveness is a swirl of global and domestic pressure. On the world stage, former U.S. President Trump’s reimposed
104% tariffs on Chinese goods have rattled investor nerves and roiled global trade. Oil prices have tumbled to four-year lows, and murmurs of stagflation in the U.S. are adding to market jitters.
Back home, the Reserve Bank of India’s cautious policy stance—hints at concerns about liquidity and growth. With India’s GDP already under pressure and external demand faltering, investor sentiment has grown more defensive.
Sectoral Shifts: Winners and Laggards
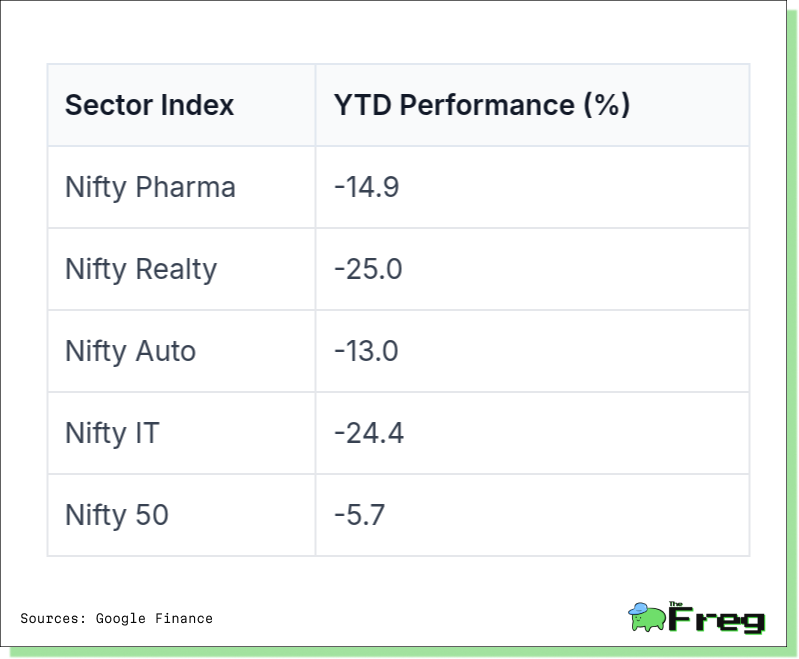
Beneath the Nifty 50’s overall decline lies a story of stark sectoral contrasts. While the broader index has corrected moderately, sectors like real estate and IT have seen much sharper drawdowns, reflecting pressure from global headwinds and domestic demand concerns.
In contrast, defensives such as pharma and relatively resilient segments like auto have limited their downside, offering some cushion to investors amid broader volatility.
This divergence highlights the growing importance of selective allocation. With market sentiment still cautious, investors are clearly favoring sectors with stronger domestic fundamentals and less global exposure.
The Role of FIIs and Retail Sentiment
Foreign Institutional Investors (FIIs), long seen as key market drivers, have recently flipped to net buyers—breaking a month-long selling streak. Their return to the table suggests a growing belief that current valuations offer opportunity rather than risk.
Domestic Institutional Investors (DIIs) have remained consistently supportive, and retail participation is showing signs of strength. SIP inflows reached ₹157 billion in April 2025, underscoring continued confidence from retail investors despite the broader market gloom.
Retail investors have now delivered positive net inflows across the past seven fiscal years. This steady hand from the domestic side has offered the Nifty a crucial buffer, even as global investors oscillate.
The Road Ahead: What History Suggests
While the Nifty’s 200-DMA breach continues to capture attention, context is everything. Compared to past crises, the current downturn remains shallow. The index is only 7% below its average—far from the 45% discount seen in 2008 or even the 34% slide during COVID-19.
Recovery timelines, too, have evolved. After 2008, it took nearly six years to hit new highs. But post-2020, the rebound came in months. Excluding major global shocks, markets typically reclaim their highs within 4–9 months after breaching the 200-DMA.
The message? This may not be a crisis—but it’s certainly a test of conviction.
Whether the current phase turns into a prolonged correction or becomes a springboard for recovery will depend on multiple variables—earnings growth, global macro stability, and policy cues. For now, the market appears to be in a “watch and wait” mode, caught between historical memory and future hope.
As always, patience and perspective remain a long-term investor’s best allies.


