

Nifty's Valuation Squeeze: What's Next?
The Nifty 50's PE ratio hits a 32-month low amid market turbulence, as investors grapple with Trump's impending "Liberation Day" tariffs. This valuation squeeze presents both opportunities and risks for Indian markets.


The Nifty 50's price-to-earnings ratio has plummeted to a 32-month low, sparking debate among investors about whether this correction presents a buying opportunity or signals deeper troubles ahead, especially as Donald Trump's looming "Liberation Day" tariffs threaten to send shockwaves through Indian markets.
Historical Trends in Nifty PE
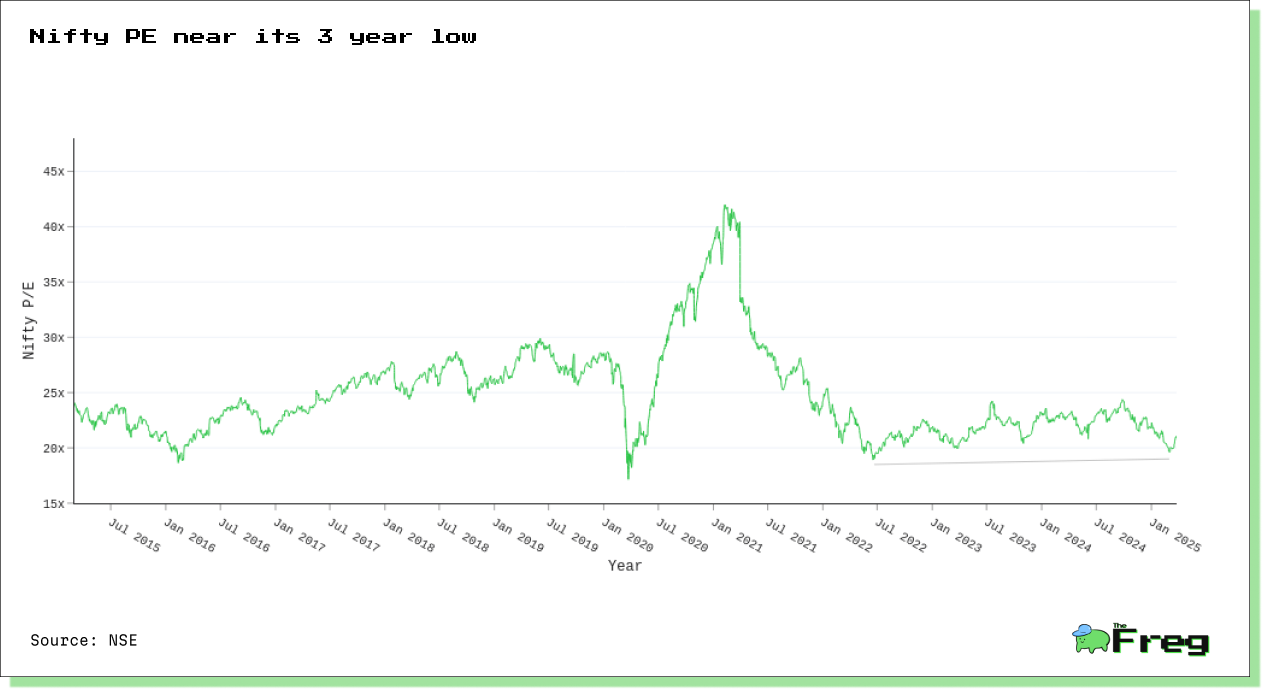
The Nifty 50's Price-to-Earnings (PE) ratio has fluctuated significantly over the past two decades, offering valuable insights into market valuations and investor sentiment. Historically, the Nifty PE has ranged from lows around 12 to highs exceeding 28, with an average hovering around 20. Key trends include:
- Peaks during bull markets: The ratio reached its highest levels during periods of strong economic growth and market optimism, such as in 2000 and 20081.
- Troughs during crises: Significant dips occurred during major economic downturns, including the 2008 financial crisis and the 2020 COVID-19 pandemic.
- Structural shift: In April 2021, the National Stock Exchange switched from using standalone to consolidated earnings for PE calculations, causing a noticeable drop in the reported ratio.
- Long-term perspective: While short-term fluctuations can be dramatic, the Nifty PE has shown a general upward trend over the past 20 years, reflecting India's growing economy and increasing investor confidence in its stock market.
It's crucial to note that while the PE ratio is a valuable metric, it should be considered alongside other factors such as earnings growth, economic conditions, and sector-specific trends when assessing market valuations.
Impact of Trump's Tariff Policy
Donald Trump's announcement of "reciprocal tariffs" set to take effect on April 2, 2025, has sent shockwaves through Indian markets and raised concerns about the potential impact on key export sectors. The proposed 25% tariffs on cars not manufactured in the US have particularly affected auto stocks, with Tata Motors shares declining 6% due to its significant exposure to the US market through Jaguar Land Rover. Other sectors likely to be impacted include chemicals, metals, auto parts, and pharmaceuticals.
The tariff threat has increased market volatility and risk aversion, with the Nifty experiencing a 14% decline from its peak and foreign institutional investors (FIIs) pulling out over $15 billion from Indian stocks. However, some analysts remain optimistic, viewing the potential 4-5% short-term correction as an investment opportunity, citing India's demographic advantages and ongoing reforms as factors that could help the country weather the trade tensions. To mitigate the impact, India may consider reducing tariffs on US imports or easing entry barriers for American companies as part of its trade negotiations strategy.
Sectoral Shifts in Nifty Valuations
The recent market correction has led to significant shifts in sectoral valuations within the Nifty 50. Information Technology (IT) and Financial Services continue to dominate, accounting for 15.16% and 20.63% of the index weightage respectively. However, the IT sector has seen a notable decline in valuations due to global economic uncertainties and reduced spending by clients.
Emerging sectors like Consumer Goods and Healthcare have gained prominence, with 3.17% and 3.49% weightage respectively. This shift reflects changing investor preferences and the resilience of these sectors amidst economic challenges. The Petroleum Products sector, despite recent volatility, maintains a strong 10.08% weightage. As the market adapts to potential tariff impacts and global trade tensions, sectors like Automobiles (7.65% weightage) and Metals & Mining (4.75% weightage) may experience further valuation adjustments.
Nifty 50 forward PE compared to global peers
This comparison reveals that the Nifty 50's forward PE ratio of 18.2
is still relatively high compared to many of its global counterparts. Only the S&P 500 in the United States has a higher forward PE at 19.3, indicating that Indian stocks are currently trading at a premium compared to most other major markets.
The data shows a significant valuation gap between the Nifty 50 and other Asian markets. For instance, China's Shanghai Composite (10.4) is trading at much lower valuations, suggesting that investors are placing a higher premium on Indian equities despite the recent correction.
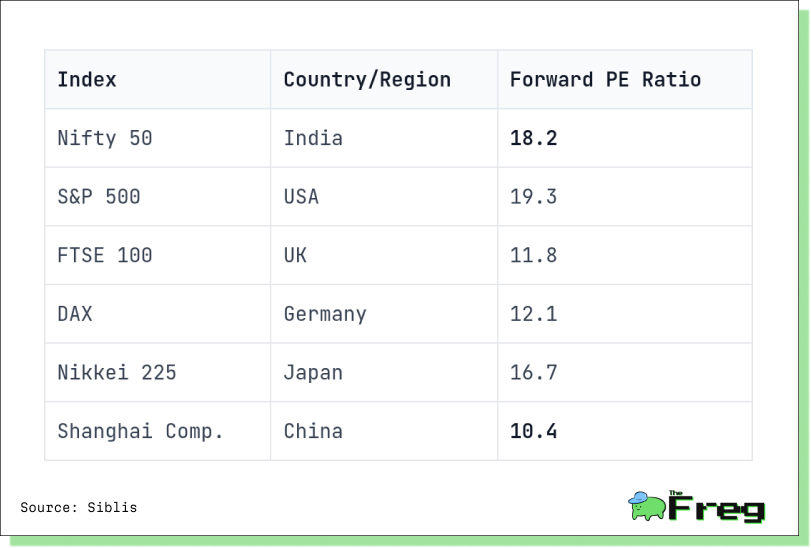
However, the relatively high valuation also implies that Indian stocks may be more vulnerable to global shocks or disappointing earnings, as seen in the recent market correction. Investors should consider these factors when assessing the risk-reward profile of investing in the Nifty 50 at current levels.


