

NTPC, NMDC: Value Buys?
Our analysis highlights the unique value opportunities in NMDC and NTPC. These stocks shows strong value characteristics and impressive recovery after drawdowns.


In today's unpredictable market landscape, the quest for value investments has become increasingly challenging. Investors are constantly searching for stocks that not only offer attractive valuations but also demonstrate resilience during market downturns. Our comprehensive analysis of NMDC (National Mineral Development Corporation) and NTPC (National Thermal Power Corporation) over the past decade reveals fascinating insights into their value characteristics, drawdown patterns, and recovery potential – potentially offering a roadmap for value-conscious investors navigating the current market environment.
The Value Factor: More Than Just Low Multiples
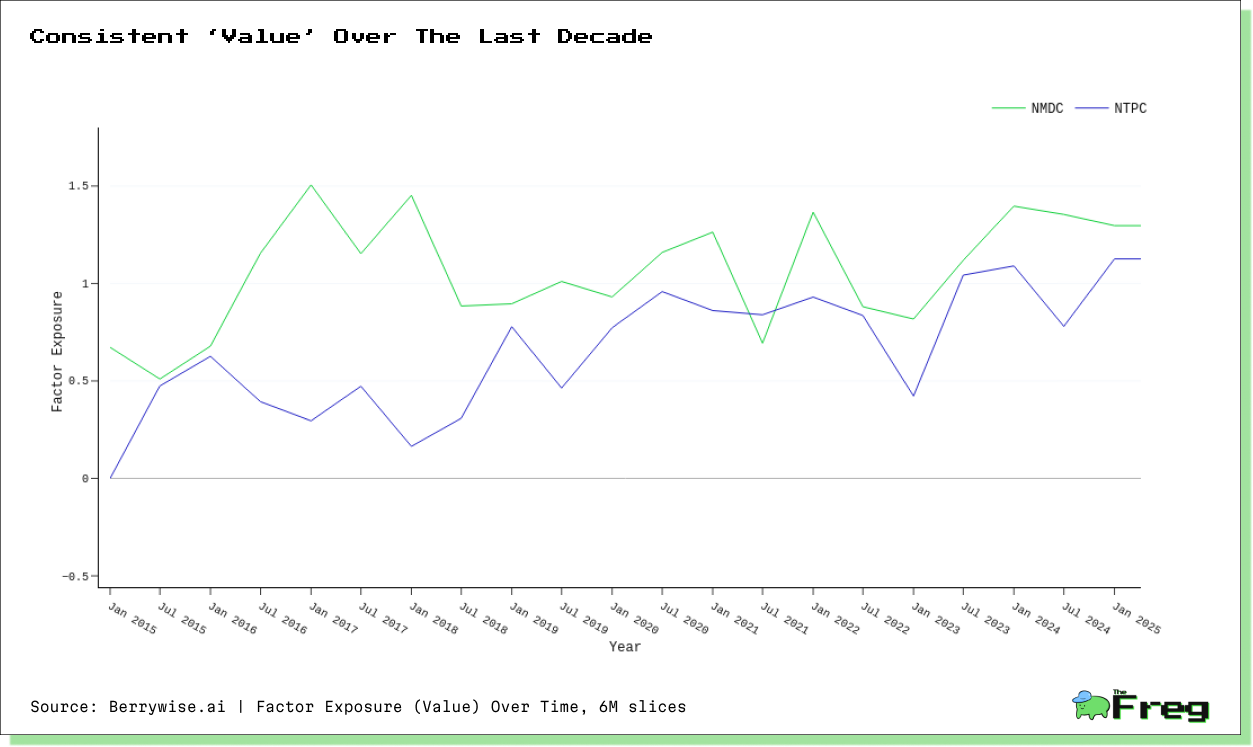
Value investing has evolved beyond simply identifying stocks with low price-to-earnings or price-to-book ratios. Today's sophisticated approach examines a stock's exposure to 'Value' factor – essentially how strongly a stock's behavior correlates with the broader value investment style. Our analysis of NMDC and NTPC against our 'Value' factor reveals distinct value characteristics for both companies, but with notable differences in how this value exposure manifests, particularly during market stress.
NMDC, India's largest iron ore producer, demonstrates consistently strong Value factor exposure with Beta values averaging approximately 1.06 over the past decade. This indicates the stock tends to move in close alignment with the broader value index. More remarkably, NMDC showed statistically significant Value factor exposure in 100% of the six-month periods analyzed, suggesting its value characteristics remain persistent across different market environments.
NTPC, India's largest power generation company, also exhibits significant Value factor exposure but with generally lower Beta values averaging around 0.68. While still firmly in value territory, NTPC's connection to the Value factor appears somewhat less pronounced than NMDC's, with 95.2% of periods showing statistically significant exposure.
NTPC's Undervalued Zone
NTPC Ltd, a major player in India's power sector, currently appears to be in an undervalued zone based on key valuation ratios compared to its historical performance. The company's Return on Equity (ROE) has increased to 13.20% versus the last 3-year average, while its debt-to-equity ratio has declined to 1.46. NTPC's future outlook is promising, with plans to add 10 GW of conventional capacity and 16 GW of renewable energy capacity in the next three years. The company aims to surpass 130 GW of overall capacity by 2032.
- NTPC's Price-to-Book (P/B) ratio stands at 2.01, while its Price-to-Earnings (P/E) ratio is 15.83, both lower than the industry average.
- The company's sales have shown a healthy growth rate of 17% over the last 3 years.
- NTPC's EBITDA margin expanded in Q3FY25, reaching 29.5% due to lower operating and manufacturing expenses.
- The company's focus on renewable energy, including the establishment of NTPC Green Energy subsidiary, positions it well for future growth in the evolving power sector.
NMDC's High Dividend Yield and Strong Financials
NMDC, India's largest iron ore producer, has consistently offered attractive dividend yields, making it an appealing option for income-focused investors. The company's current dividend yield stands at 3.44%, which is higher than the bottom 25% of dividend payers in the Indian market and places it in the top 25% of dividend payers overall. This high yield is particularly noteworthy given NMDC's status as a Navratna PSU and its crucial role in India's mining sector.
NMDC's Q3 FY25 financial results showcase robust growth across key metrics. The company reported a total income of ₹6,942.92 crores, marking a significant
31.5% increase quarter-on-quarter and a 20.8% rise year-on-year. Profit After Tax (PAT) surged to ₹1,898.62 crores, reflecting a 57.5% growth from the previous quarter and a 27.9% increase compared to the same period last year.
- Production volume reached 13.29 million tonnes, up 9% year-on-year.
- Sales volume grew to 11.94 million tonnes, a 5% increase from the previous year.
- Profit Before Tax (PBT) stood at ₹2,583.85 crores, showing a
substantial 60.1% quarter-on-quarter growth. - Total expenses increased by 18.9% quarter-on-quarter to ₹4,359.07 crores.
These results demonstrate NMDC's strong operational performance and financial health, positioning the company well for continued growth in the iron ore sector.
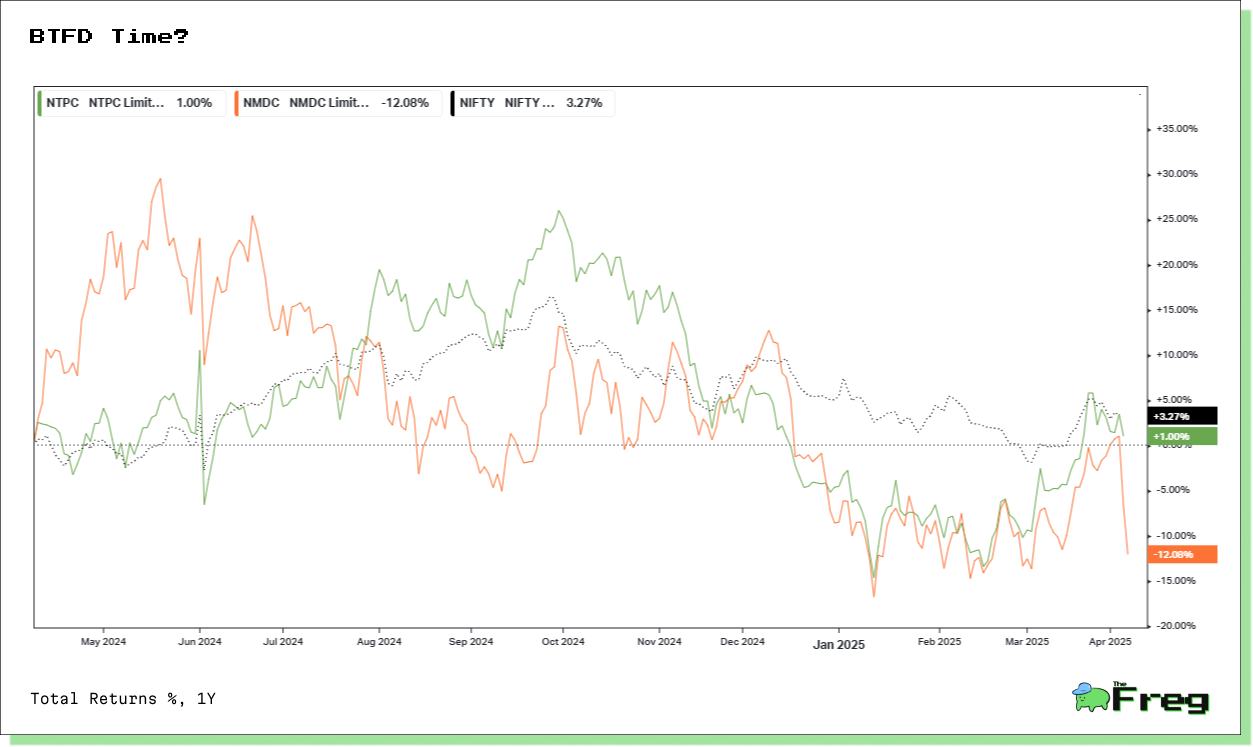
Year-Long Stock Slump
NTPC and NMDC have experienced contrasting fortunes over the past year, reflecting the diverse challenges faced by India's power and mining sectors. NTPC has shown resilience, with its stock price up only marginally by 1% over the past year.
In contrast, NMDC has faced a more significant slump, with its stock price
falling by 12% over the past year. This decline can be attributed to several factors:
- Proposed mining tax increases in Karnataka, a key production region for NMDC.
- Broader volatility in the mining and minerals sector.
- Global economic uncertainties affecting commodity prices and demand.
Despite these challenges, NMDC maintains a strong long-term fundamental position, with a high dividend yield and return on equity (ROE) of 23.57%. The company's ability to weather this slump may depend on its adaptability to changing market conditions and regulatory environments.
Tale of Two Value Stocks: Divergent Behavior During Drawdowns
Perhaps the most intriguing aspect of our analysis emerges when examining how these stocks behave during significant market drawdowns – periods where prices fall at least 10% from their peaks. Here, we observe a striking divergence between these two value stalwarts.
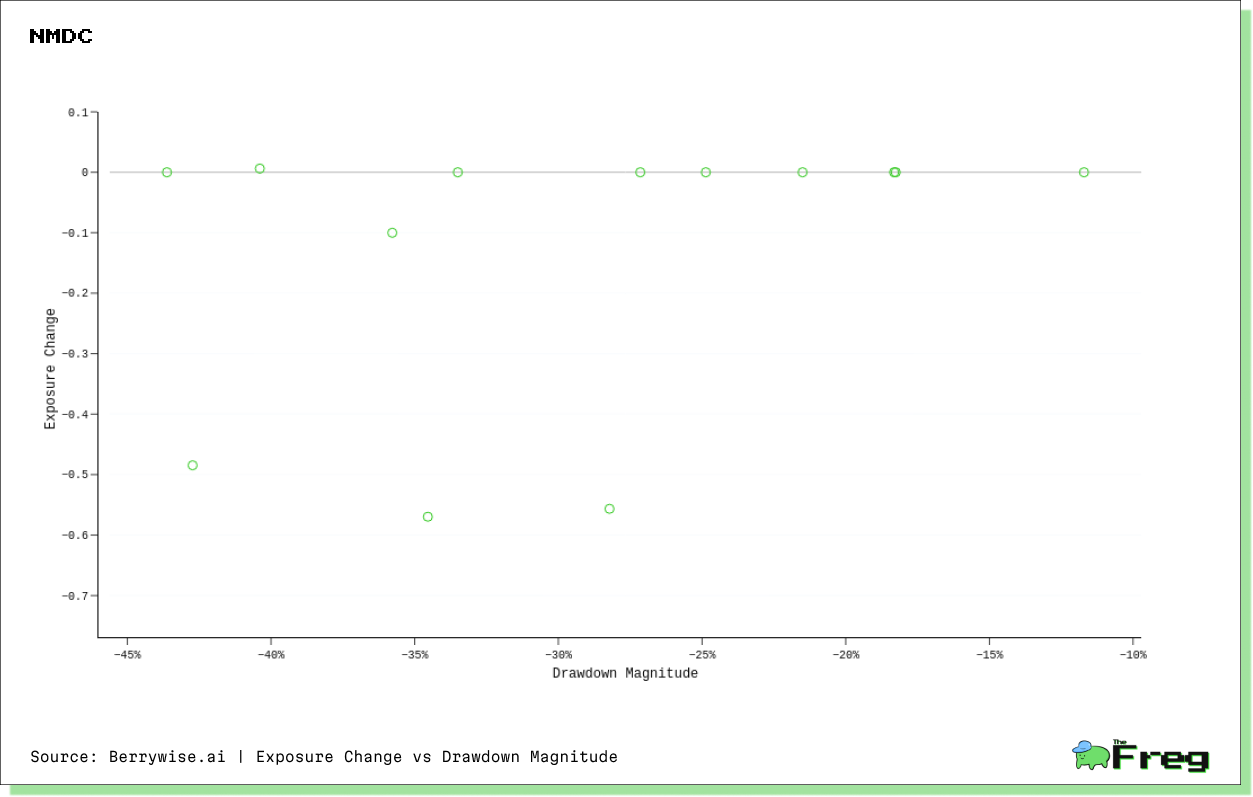
NMDC typically experiences a decrease in its Value factor exposure during drawdowns, with only 7.7% of drawdown periods showing increased value characteristics. This suggests that during market stress, NMDC temporarily loses some of its value identity, potentially behaving more like a growth or momentum stock. The average Beta change during drawdowns is relatively small at -0.1311, confirming this shift away from value characteristics under pressure.
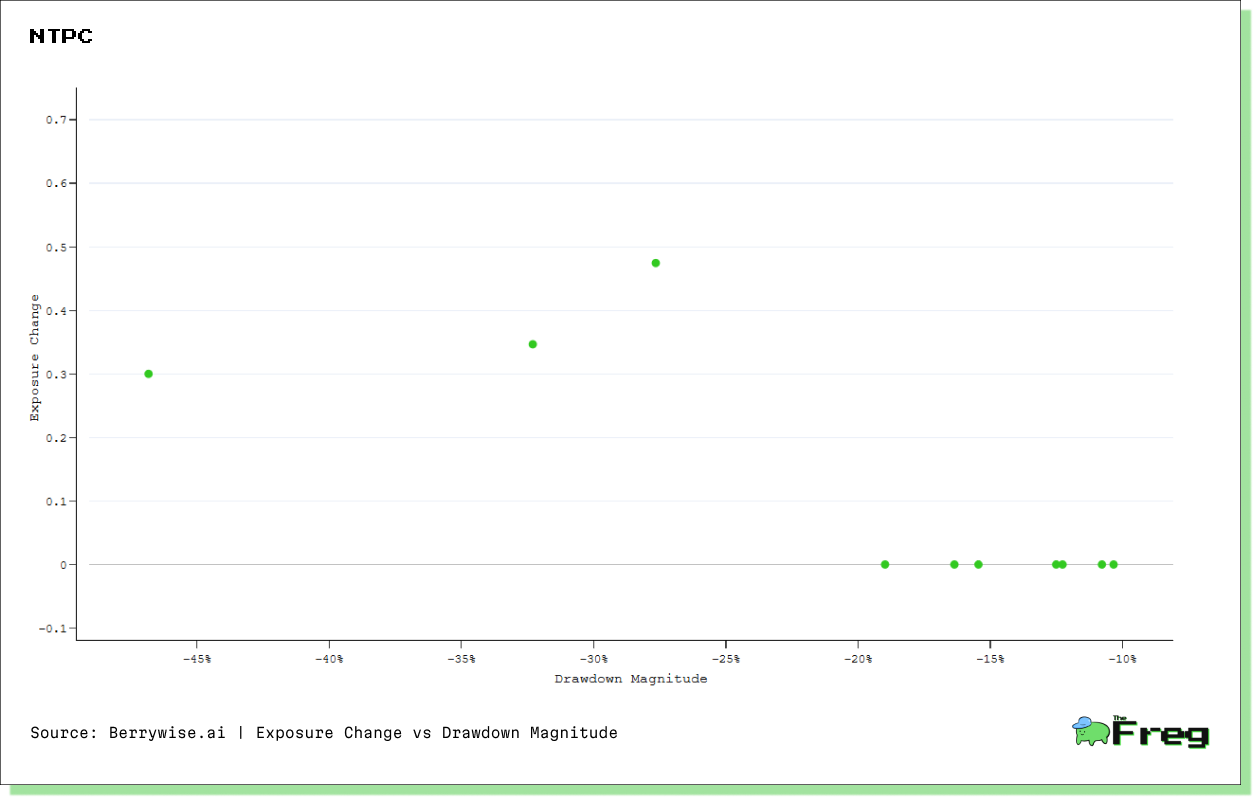
NTPC, conversely, shows a more balanced pattern, with 30% of drawdowns accompanied by increased Value factor exposure. The average Beta change during drawdowns is +0.1121, again relatively small but indicating that NTPC often strengthens its value characteristics during market stress. This makes NTPC potentially more attractive to investors seeking "pure" value exposure that persists or even intensifies during downturns.
Recovery Champions: The Post-Drawdown Performance
For long-term investors, how a stock recovers from drawdowns can be even more important than the drawdowns themselves. Here, NMDC emerges as the clear recovery champion.
Following major drawdowns, NMDC delivers impressive average returns of 44.56% over six months and a remarkable 61.76% over one year. This exceptional recovery potential suggests that market overreactions to the downside in NMDC often present compelling buying opportunities for patient investors.
NTPC, while still showing respectable recovery performance, lags behind with average post-drawdown returns of 18.08% over six months and
41.46% over one year. The recovery duration for NTPC also tends to be longer (149.6 days on average) compared to NMDC (130.9 days), indicating a somewhat slower return to previous highs.
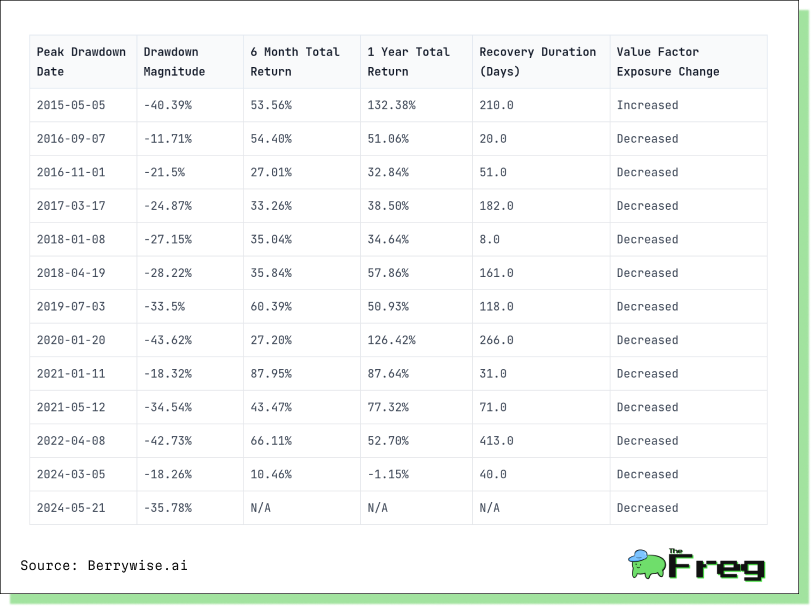
NMDC Drawdown Analysis Summary
- Total Drawdowns Exceeding -10%: 13
- Maximum Drawdown: -43.62%
- Average Drawdown Magnitude: -29.28%
- Average 6-Month Return After Drawdown: 44.56%
- Average 1-Year Return After Drawdown: 61.76%
- Average Recovery Duration: 130.9 days
- Drawdowns with Increased Value Factor Exposure: 1 (7.7%)
- Average Beta Change During Drawdowns: -0.1311
NMDC Drawdowns Exceeding -10%
Total number of major drawdowns: 13
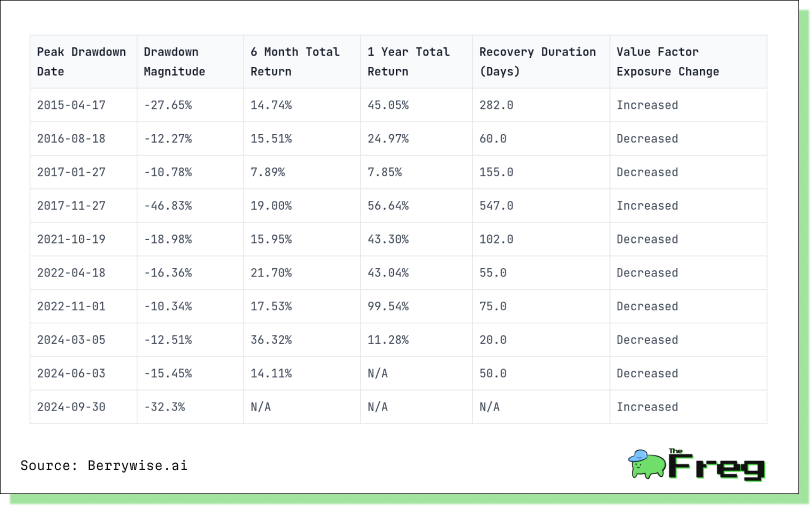
NTPC Drawdown Analysis Summary
- Total Drawdowns Exceeding -10%: 10
- Maximum Drawdown: -46.83%
- Average Drawdown Magnitude: -20.35%
- Average 6-Month Return After Drawdown: 18.08%
- Average 1-Year Return After Drawdown: 41.46%
- Average Recovery Duration: 149.6 days
- Drawdowns with Increased Value Factor Exposure: 3 (30.0%)
- Average Beta Change During Drawdowns: 0.1121
NTPC Drawdowns Exceeding -10%
Total number of major drawdowns: 10
The Current Market Context: Are These Deep Value Opportunities Now?
As of April 2025, both stocks present interesting value propositions, albeit with different risk-reward profiles.
NMDC is currently experiencing a significant drawdown, trading approximately 35.78% below its 52-week high (as of May 2024 peak). Historical patterns suggest this could represent an attractive entry point, particularly given NMDC's strong track record of post-drawdown recoveries. The company's latest Value factor
Beta of 1.29 (January-April 2025) indicates its value characteristics remain robust despite the recent price weakness.
The iron ore sector faces headwinds from global economic uncertainty and fluctuating commodity prices, but NMDC's dominant market position in India and relatively low production costs provide some insulation. The company's strong balance sheet and consistent dividend history further enhance its appeal as a value investment.
NTPC presents a different value proposition. The stock's latest drawdown (32.30% from September 2024 peak) coincides with an increase in its Value factor exposure, consistent with its historical pattern of strengthening value characteristics during market stress. With a latest Value factor Beta of 1.12 (January-April 2025), NTPC currently exhibits stronger value characteristics than its historical average.
The power sector's defensive nature and NTPC's status as India's largest power generator provide stability during economic uncertainty. The company's ongoing transition toward renewable energy sources also positions it well for long-term growth, potentially offering value investors both defensive characteristics and exposure to the green energy transition.
Investment Strategy: Timing and Allocation Considerations
For investors seeking to capitalize on these value opportunities, historical patterns suggest different approaches for each stock.
For NMDC:
- The current significant drawdown aligns with historical patterns where the stock has delivered exceptional post-drawdown returns.
- Investors might consider a phased entry strategy, allocating capital gradually to account for potential continued volatility in the commodities sector.
- Historical data suggests patience will likely be rewarded, with the most substantial returns typically materializing over a one-year horizon.
For NTPC:
- The increased Value factor exposure during the current drawdown makes it particularly attractive for investors seeking "pure" value exposure.
- The stock's more moderate but still respectable recovery potential suggests it may be better suited for investors with lower risk tolerance.
- The longer average recovery duration indicates investors should be prepared for a potentially extended holding period.
Conclusion: Complementary Value Opportunities
Rather than choosing between these two value stocks, investors might consider allocating to both as complementary components of a value-oriented portfolio.
NMDC offers higher recovery potential but with more pronounced drawdowns and temporary shifts away from value characteristics during market stress.
NTPC provides more consistent value exposure, particularly during downturns, albeit with more moderate recovery potential.
The current market environment, characterized by elevated volatility and sector rotation, creates an opportune moment for value investors to consider these stocks. Both NMDC and NTPC are trading significantly below their recent highs while maintaining strong Value factor exposure, potentially offering attractive entry points for long-term investors willing to weather near-term volatility.
As always, investors should consider their own risk tolerance, investment horizon, and portfolio diversification needs when evaluating these opportunities. The historical patterns identified in our analysis provide valuable context but do not guarantee future performance. Nevertheless, for investors seeking deep value opportunities in the current market, NMDC and NTPC certainly warrant serious consideration.
Disclaimer: This article is based on data analysis and does not constitute investment advice. Investors should conduct their own research and consult with financial advisors before making investment decisions. Past performance is not indicative of future results.


