

S&P 500 Showdown: Traditional vs. Equal-Weighted vs. Top 30
Comparing the S&P 500, Equal-Weighted, and Top 30 indices—exploring performance, risks, diversification, and factor exposures to guide smarter investing.


Investing in Exchange-Traded Funds (ETFs) has gained immense popularity due to their simplicity and long-term benefits. Among ETF options, the S&P 500 is widely regarded as the benchmark for the U.S. stock market. However, investors have multiple choices within this space, including:
- Traditional S&P 500 (Market-Cap Weighted)
- S&P 500 Equal-Weighted Index
- S&P 500 Top 30
Each offers distinct advantages and aligns with different investment strategies.
Diversification vs. Focus
- The traditional S&P 500 reflects the market’s natural size bias, where larger companies exert greater influence. This provides broad market exposure and balanced performance across different market cycles.
- The Equal-Weighted Index assigns equal weight to all companies, reducing the dominance of mega-cap stocks and increasing exposure to smaller firms. While this enhances growth potential, it also introduces higher volatility.
- The Top 30 Index focuses on the largest 30 companies in the S&P 500, offering concentrated exposure to dominant market players. This strategy excels during mega-cap growth periods but struggles when those companies or sectors underperform.
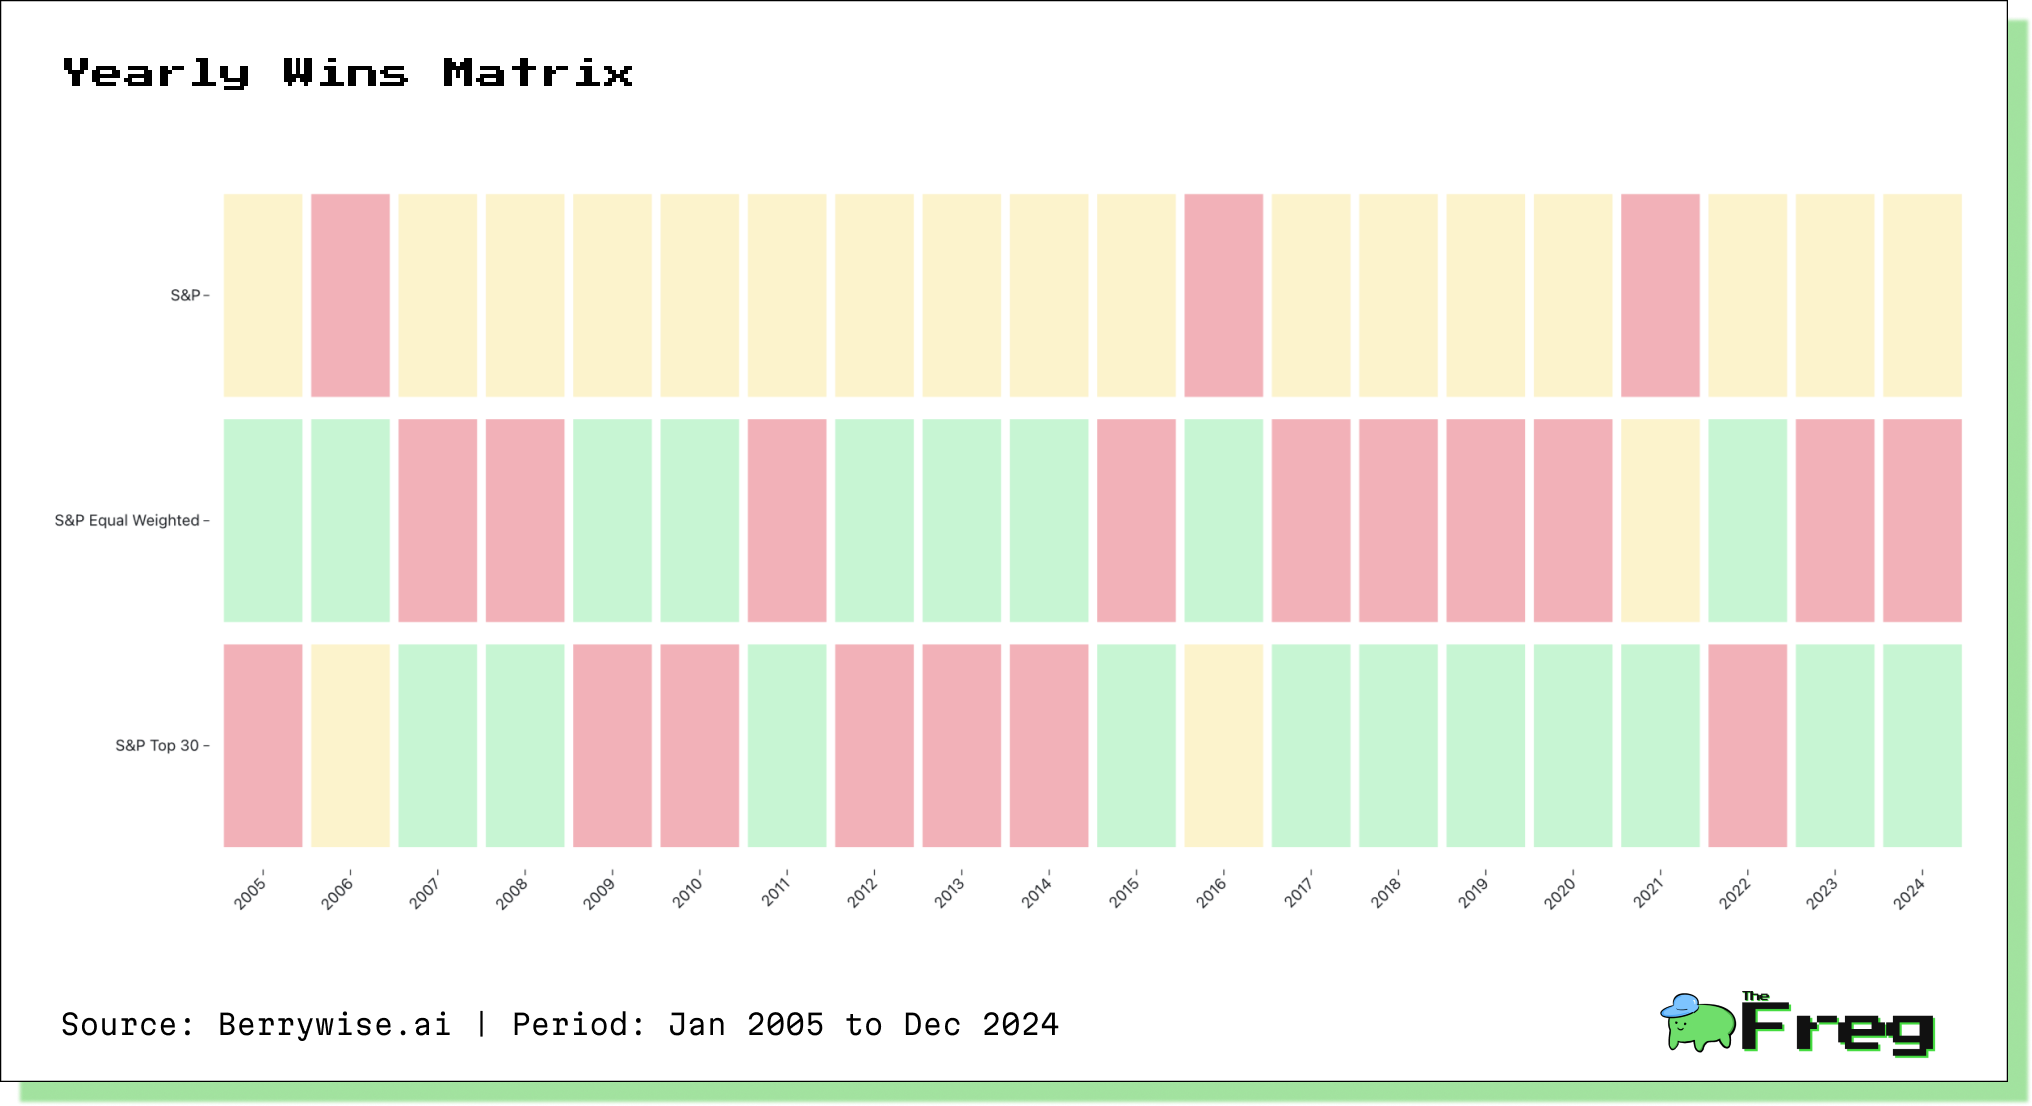
Winners and Losers: Yearly Performance
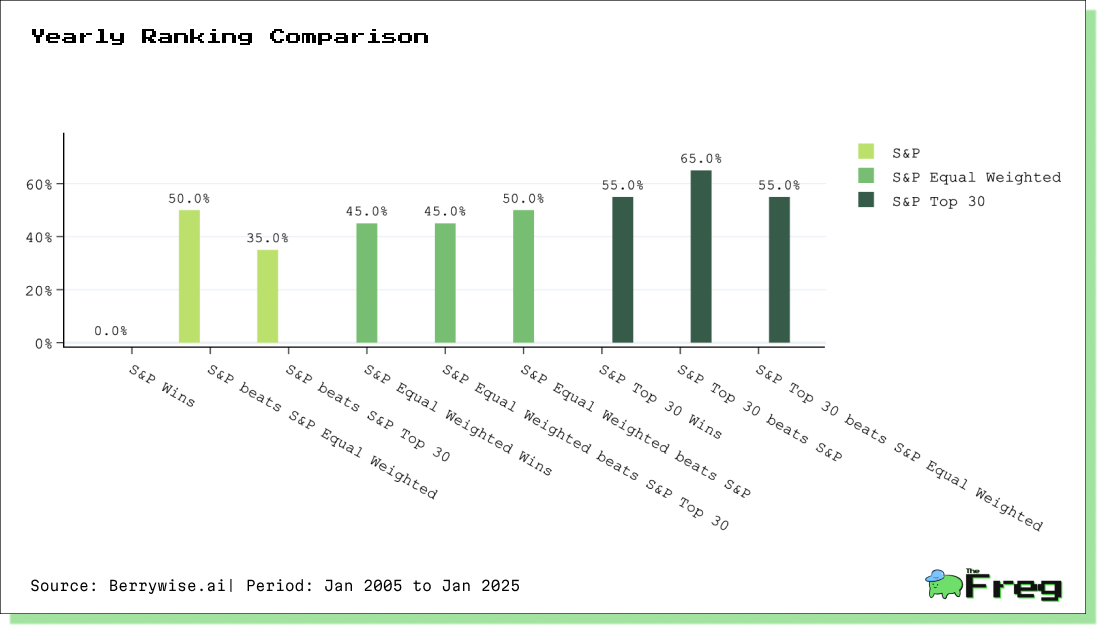
A historical comparison over the past 15 years reveals some interesting trends:
- Traditional S&P 500 ranked first 0% of the time.
- S&P 500 Equal-Weighted Index ranked first in 45% of the years.
- S&P 500 Top 30 ranked first in 55% of the years.
- Traditional S&P 500 delivers balanced, middle-ground performance.
- Equal-Weighted Index outperforms during market recoveries due to its higher exposure to smaller firms.
- Top 30 Index shines during bull markets, benefiting from mega-cap stock dominance.
Performance Analysis
Cumulative Returns
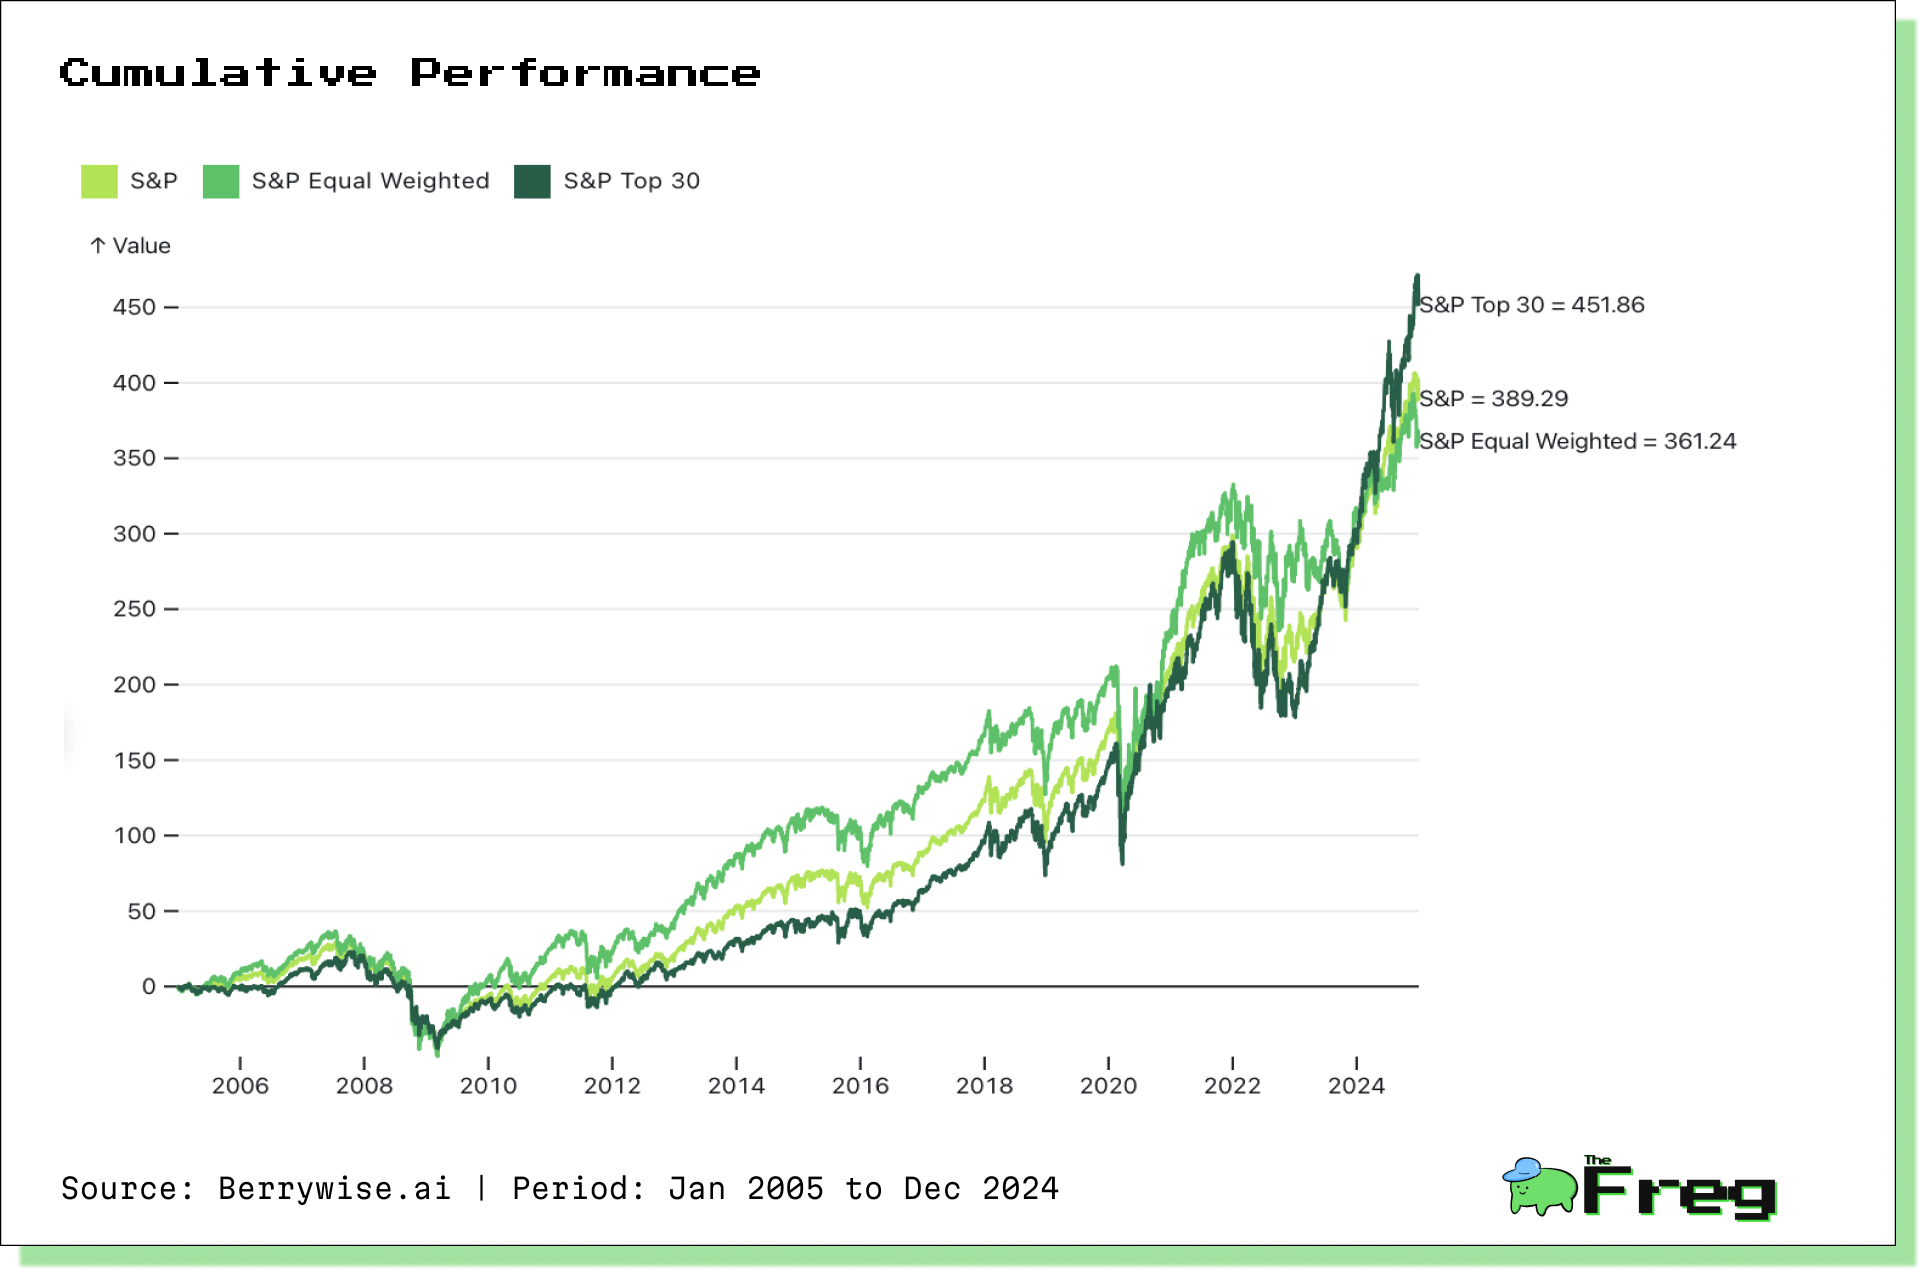
Overall, the cumulative return of the S&P 500 Top 30 outperformed the S&P 500 by 6% and the Equal-Weighted Index by 9%.
However, until 2024, the S&P 500 Equal-Weighted Index was the best performer. This was due to its increased exposure to small-cap stocks, which have higher market betas and offer greater long-term premiums.
Additionally, its rebalancing mechanism—selling winners and buying losers at each rebalancing period—creates a mean-reversion, contrarian strategy that may contribute to higher long-term returns.
Recently, however, the strong performance of the "Magnificent 7" stocks has overshadowed the rest of the index.
Rolling CAGR Trends
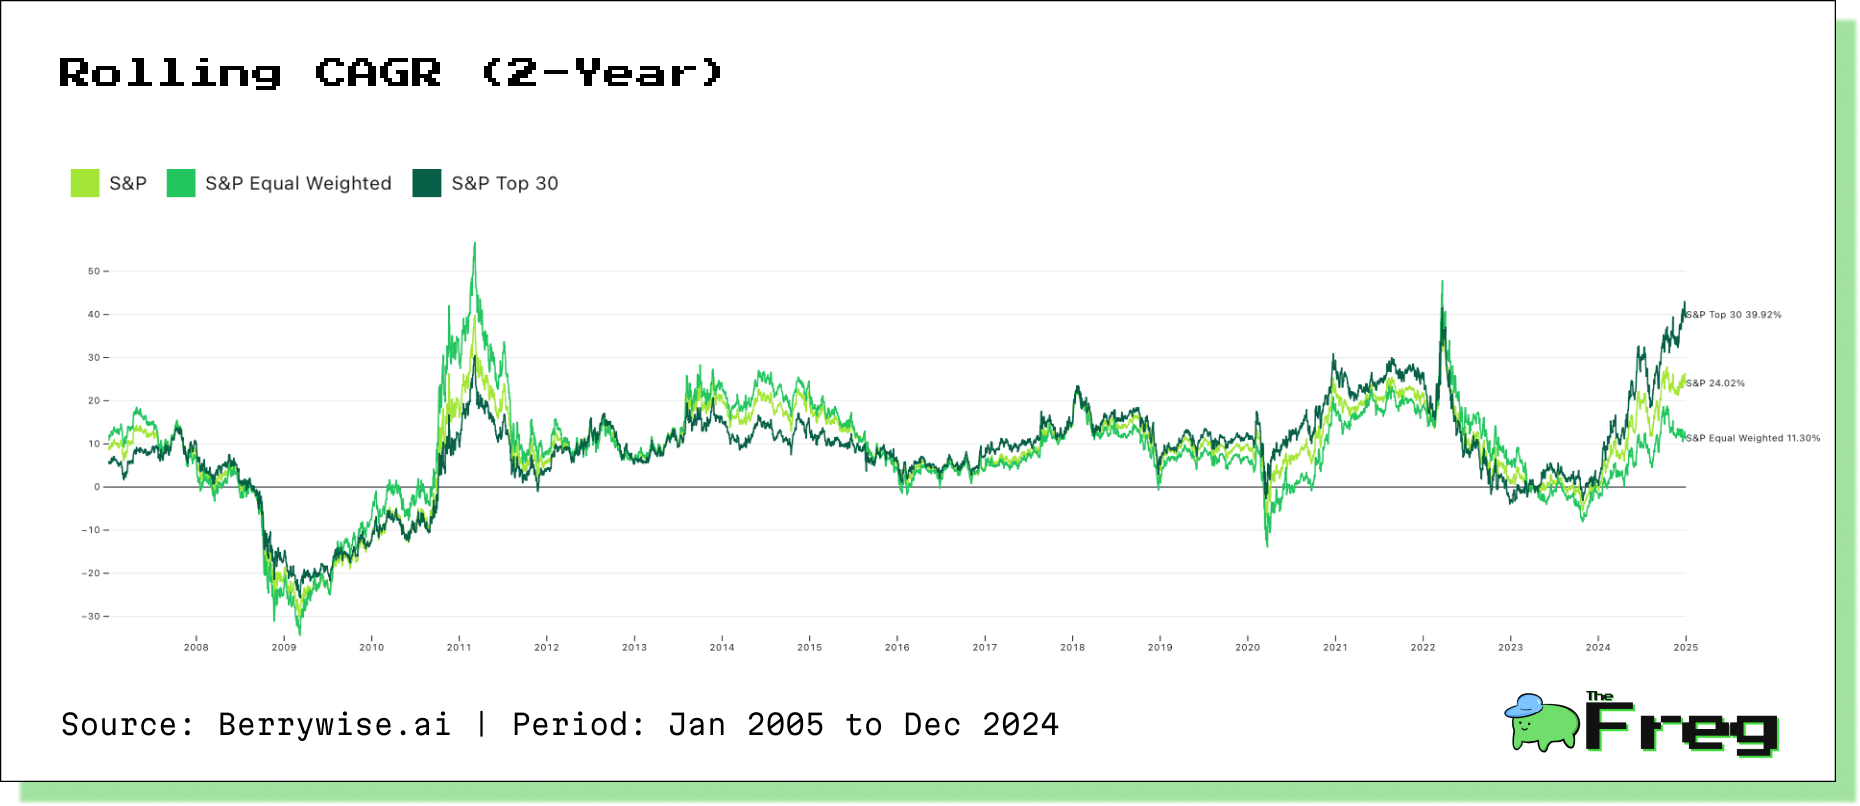
The rolling CAGR with a 2-year rolling period highlights the stability of performance over time.
Until 2016, the S&P 500 Equal-Weighted Index was the best performer. However, after that, an inflection point occurred, where the S&P 500 Top 30 began to dominate, while the Equal-Weighted Index generally showed lower performance.
Risk and Return Metrics
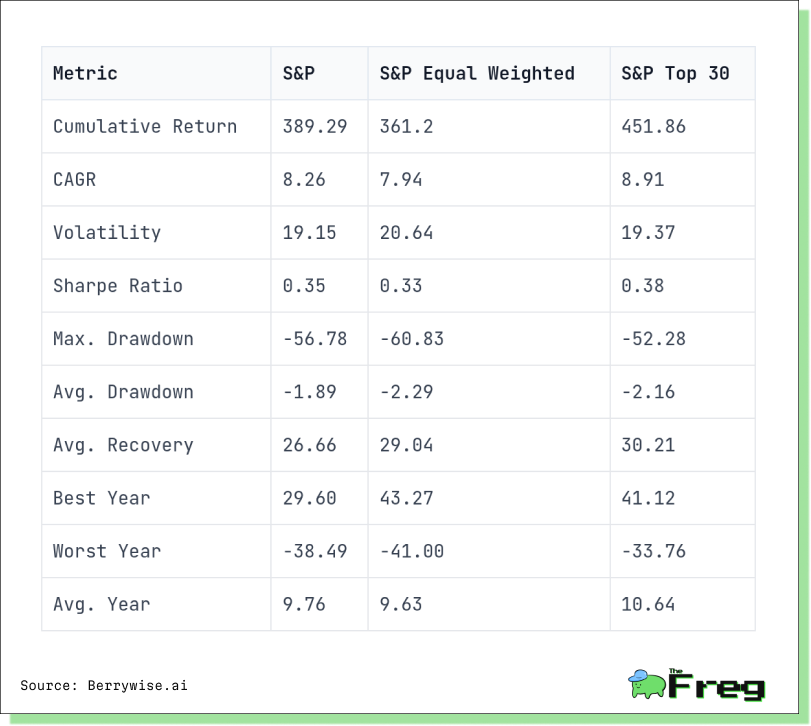
Risk-Return Tradeoffs:
- Traditional S&P 500 has the fastest recovery time from drawdowns, making it a safer bet during downturns.
- Equal-Weighted Index provides greater diversification but also higher volatility and larger drawdowns.
- Top 30 Index has the best risk-adjusted returns, as shown by its Sharpe ratio.
Drawdown Analysis:
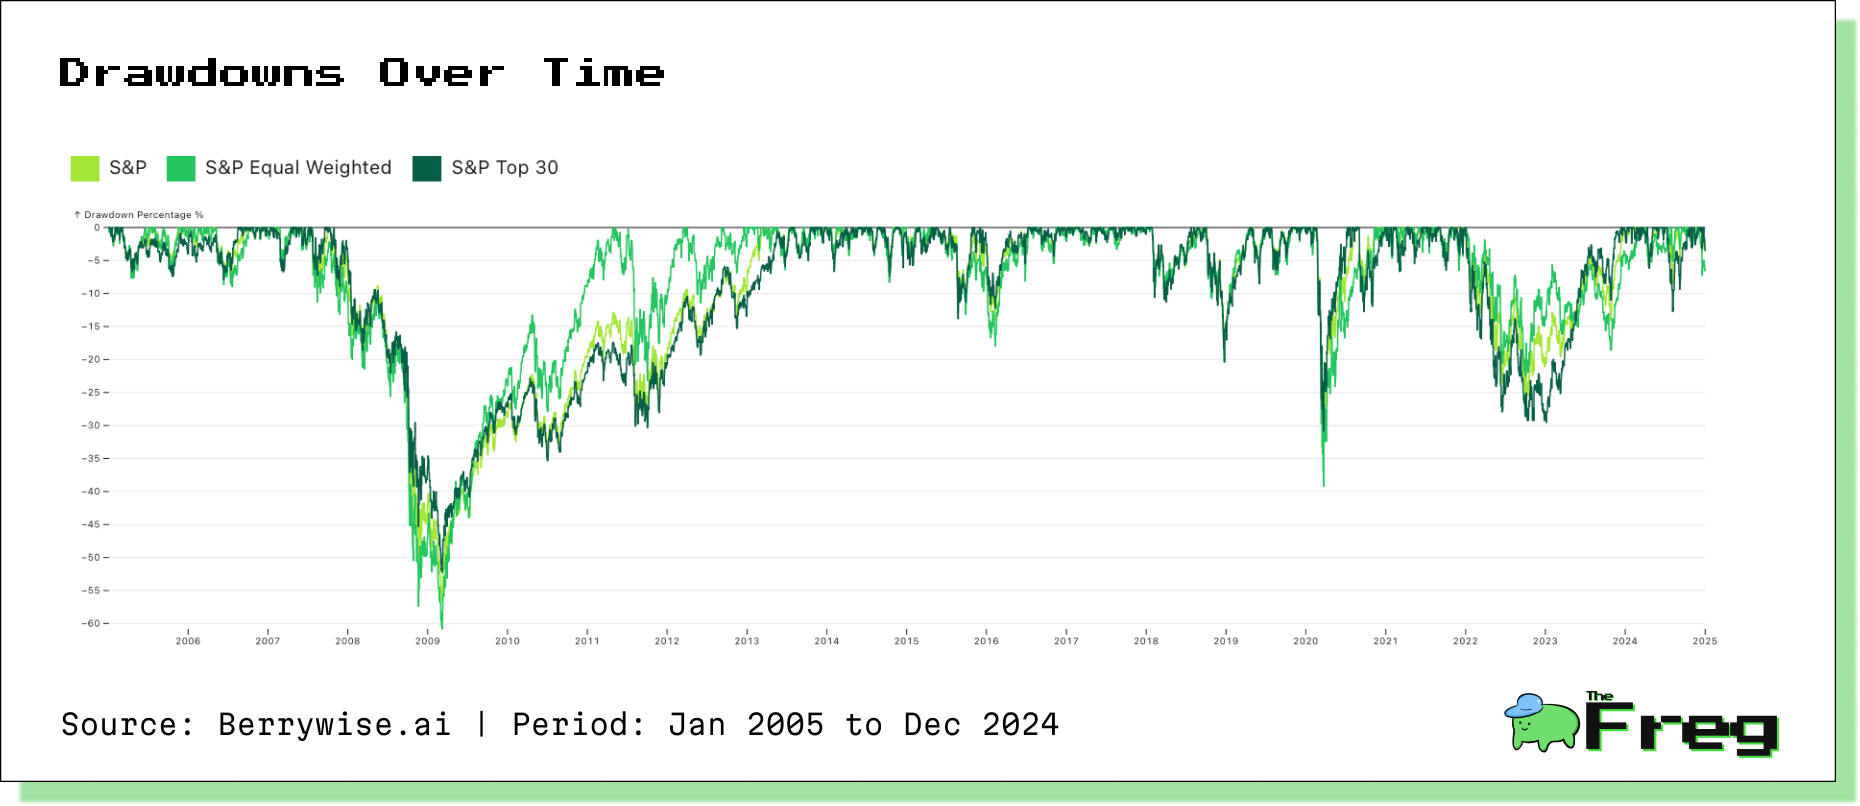
- 2008 Crash: Equal-Weighted Index suffered the largest drawdown, while Top 30 was least affected.
- 2010–2016: Trend reversed—Equal-Weighted Index outperformed.
- 2020 Pandemic: Top 30 Index had the smallest drawdown, but more recent downturns hit it hardest.
Understanding Factor Tilts
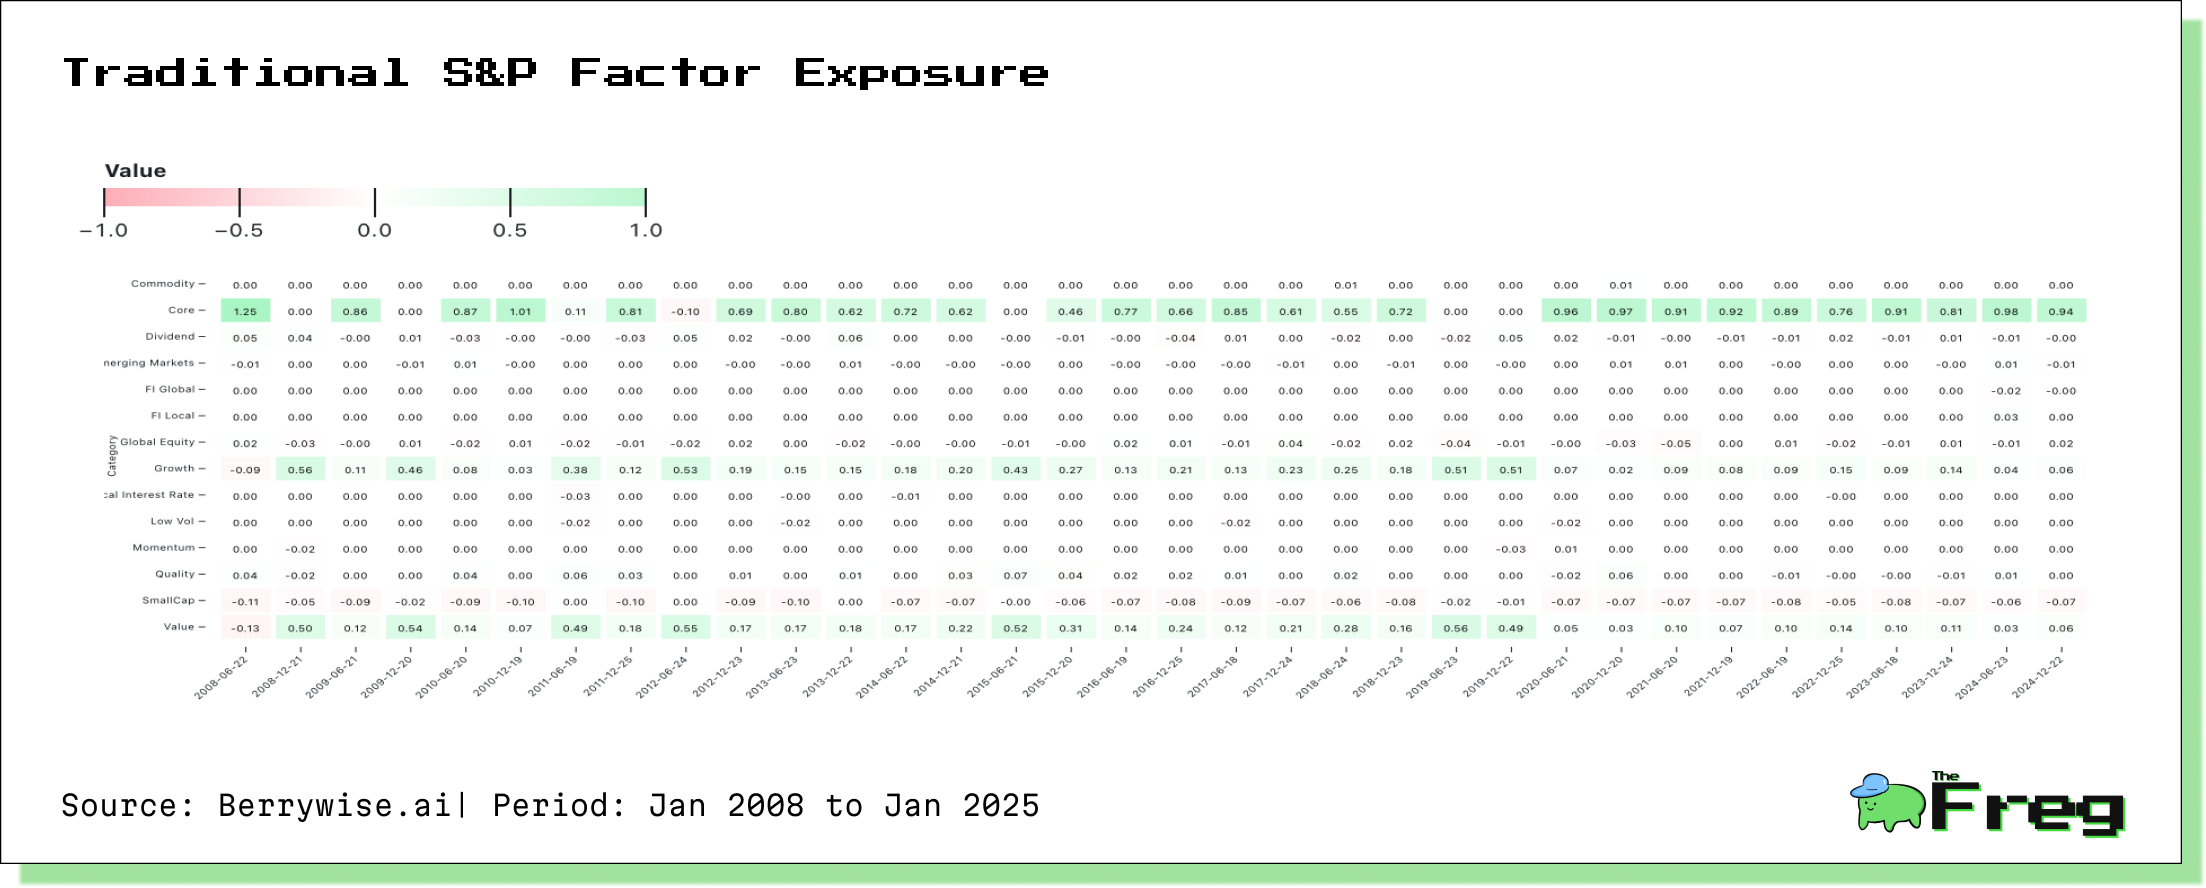
S&P 500 (Traditional): Primarily exposed to core factors, but during downturns, it shifts towards value and growth.
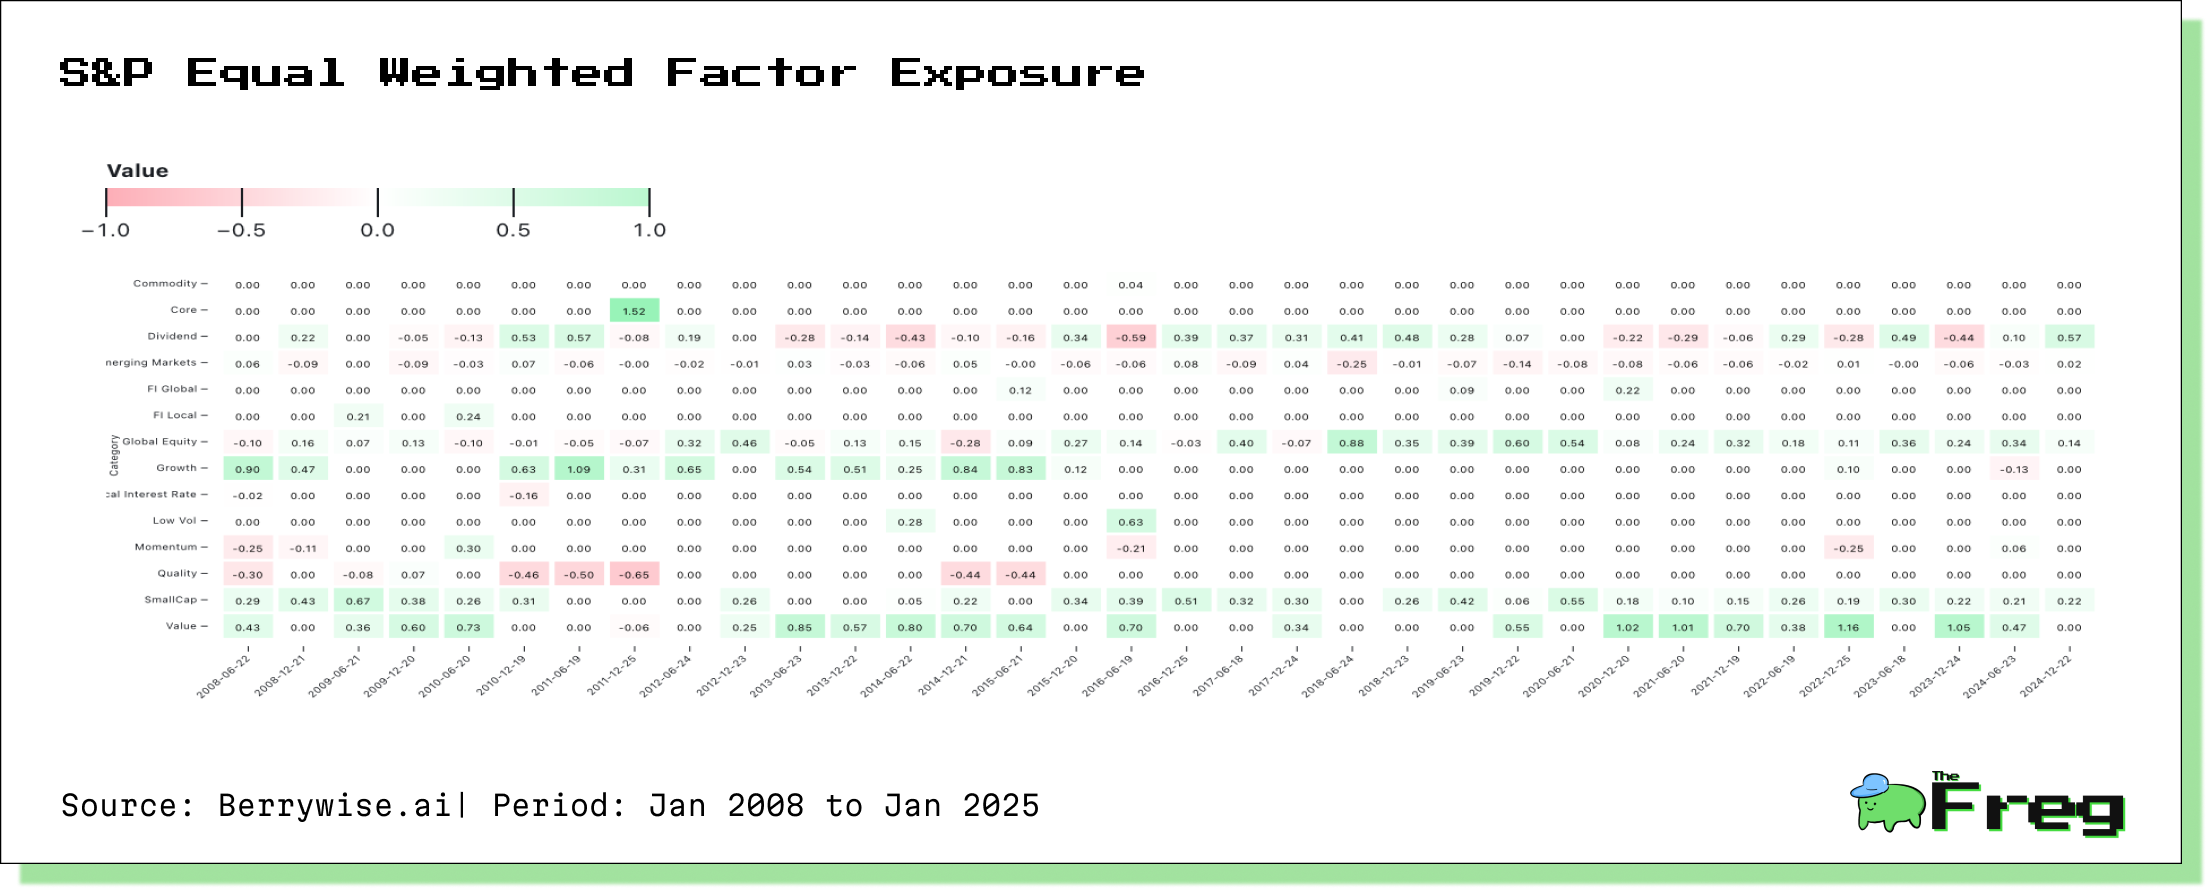
S&P Equal-Weighted Index: Higher exposure to small-cap, value, and growth factors; negatively exposed to core and quality factors.
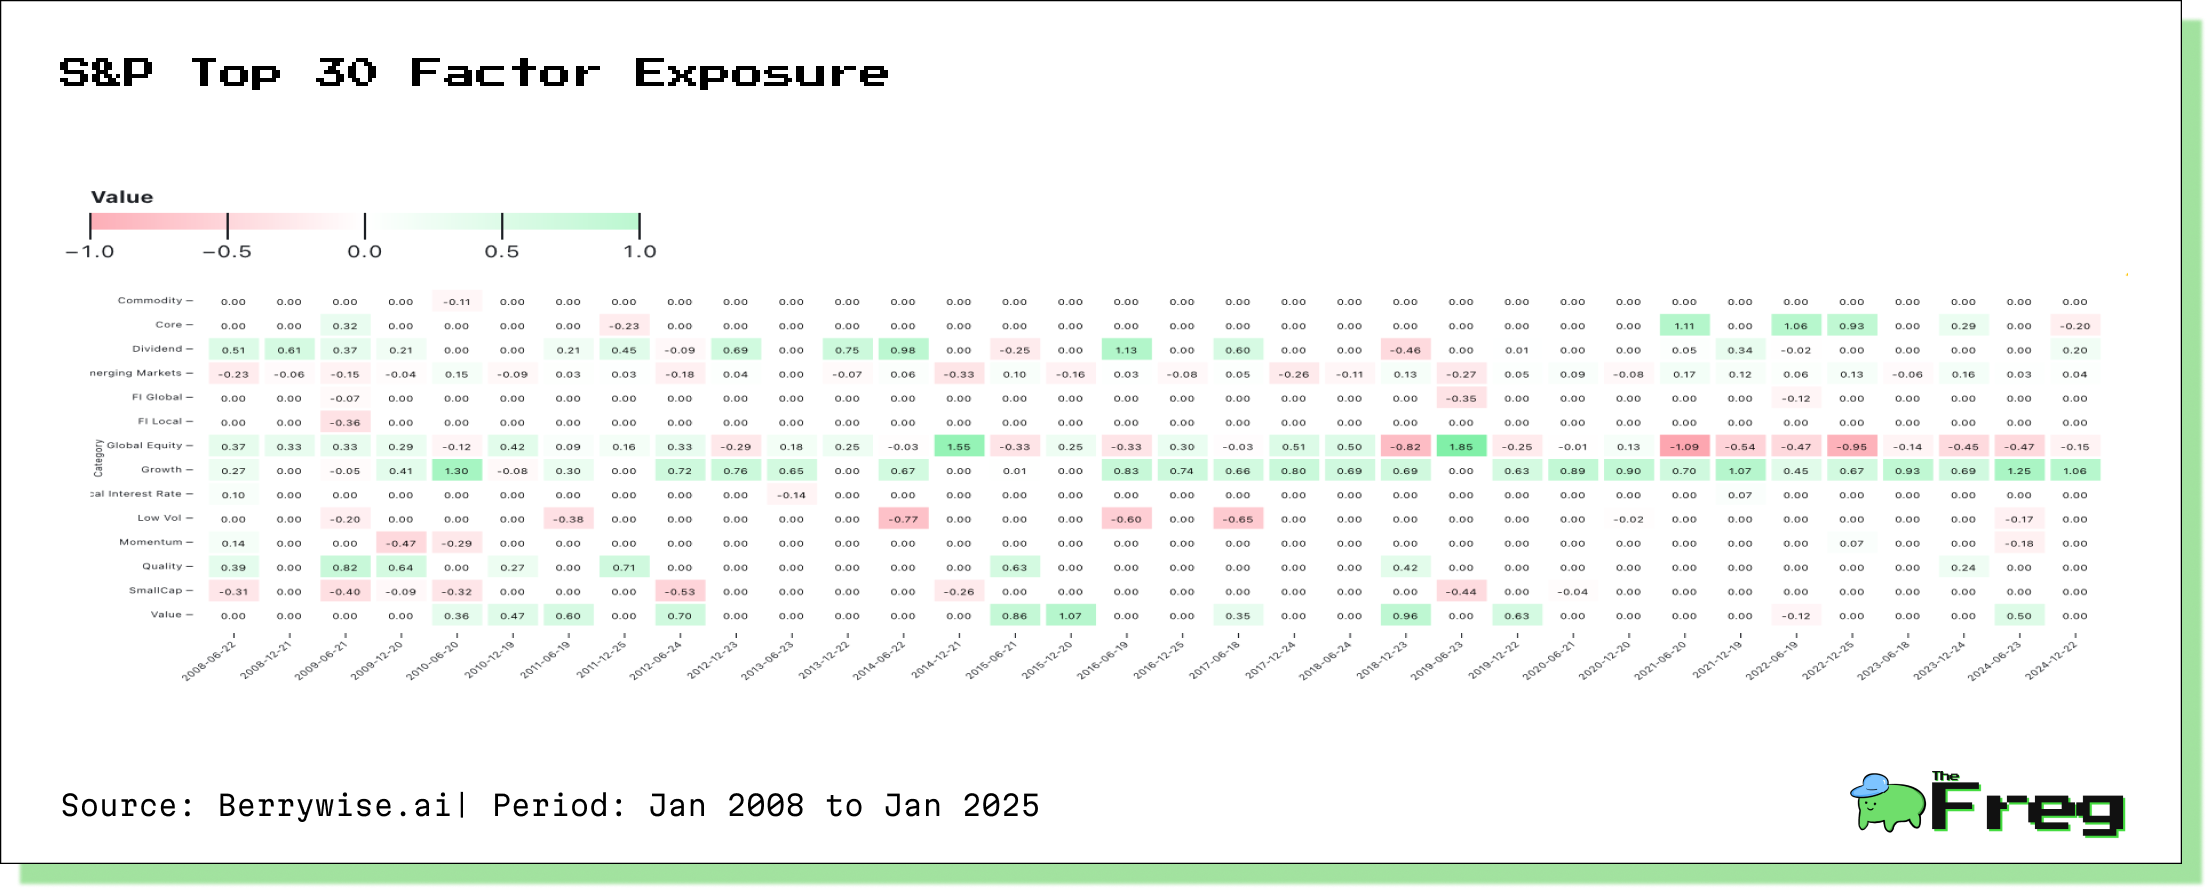
Top 30 Index: Most varied exposure profile; since 2018, global equity exposure turned negative; leans heavily towards growth factors.
Traditional S&P 500 → Balanced and steady, suitable for conservative, long-term investors.
Equal-Weighted Index → Greater growth potential but comes with higher volatility.
Top 30 Index → Outperforms in mega-cap rallies but is highly vulnerable to sector downturns.
Understanding these differences can help investors align their investments in variants of S&P 500 with their financial goals and risk tolerance.
Disclaimer: This article is based on data analysis and does not constitute investment advice. Investors should conduct their own research and consult with financial advisors before making investment decisions. Past performance is not indicative of future results.


